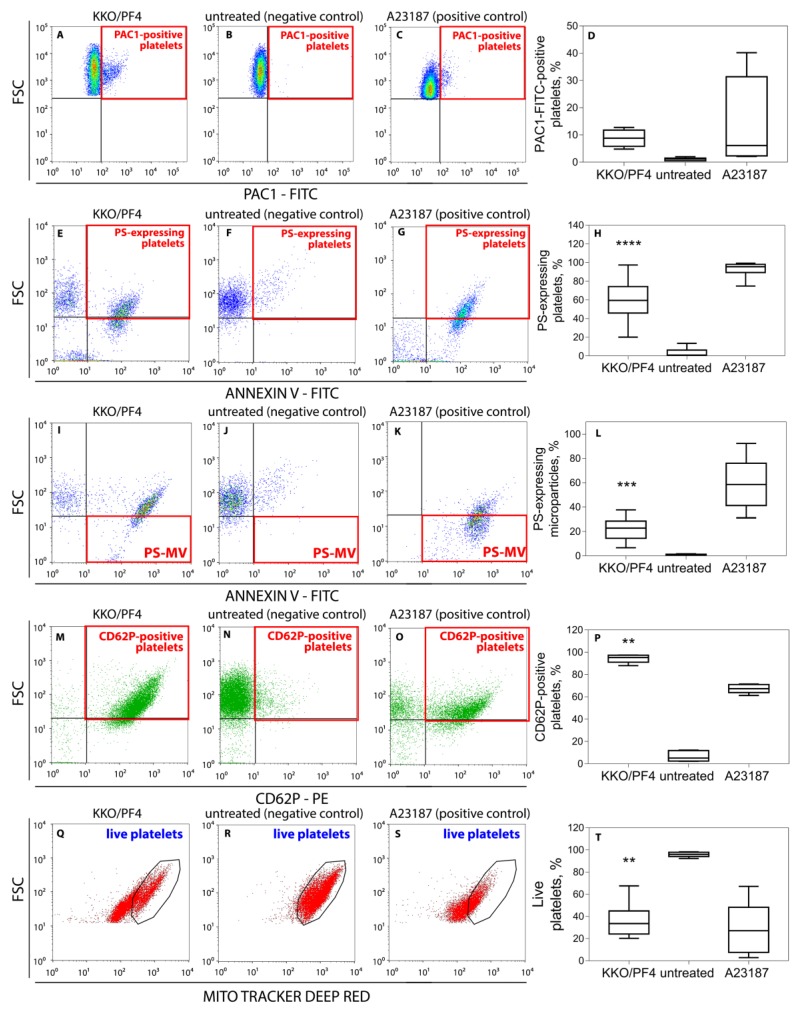
Figure 1.
Representative dot-plots and averaged results of platelet flow cytometry under various experimental conditions. (A–D) Expression of the active integrin αIIbβ3 on the surface of platelets determined with PAC1-FITC-Abs. (E–L) Expression of phosphatidylserine on the surface of platelets (E–H) and platelet microvesicles (I–L) labeled with Annexin V-FITC. (M–P) Expression of P-selectin (CD62P) on platelets labeled with anti-CD62P-PE-Abs. (Q–T) Fractions of live platelets (gated CD41-positive particles) with normal mitochondrial membrane potential (ΔΨm) determined with a ΔΨm-sensitive dye MitoTracker Deep Red. Platelets were incubated for 60 min without (negative control) or with a mixture of KKO (pathogenic monoclonal anti-PF4/heparin Ab) (50 μg/mL KKO) and PF4 (10 μg/mL) or 10 μM calcium ionophore (positive control). Red squares indicate the quadrants and black circles (Q–S) indicate the gates with quantified signals. Each experiment was performed with platelets isolated from at least three independent donors. ** p < 0.01, *** p < 0.001, **** p < 0.0001 compared to a corresponding negative control (Kruskal–Wallis test with Dunn’s post-hoc test).

