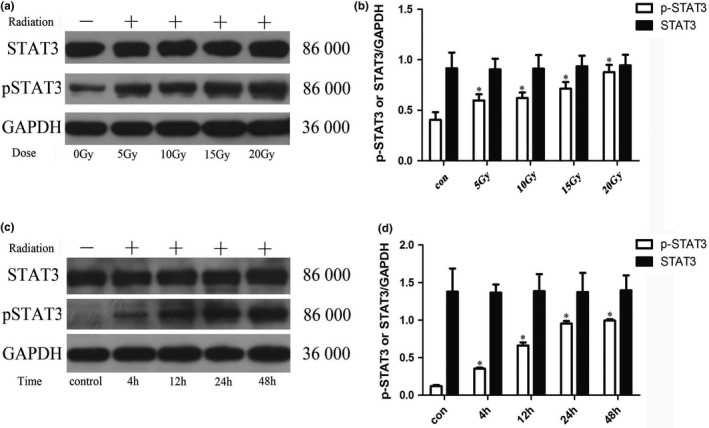
Figure 7.

Changes of STAT3 and p‐STAT3 proteins expression in astrocytes of each group (n = 5, mean standard deviation). (a, c) STAT3 and p‐STAT3 proteins expression electrophoresis results. (b, d) Statistical analysis of STAT3 and p‐STAT3 proteins expression intensity. *Compared with the control group or the 0 Gy irradiation group, p < .05
