
Figure 3.
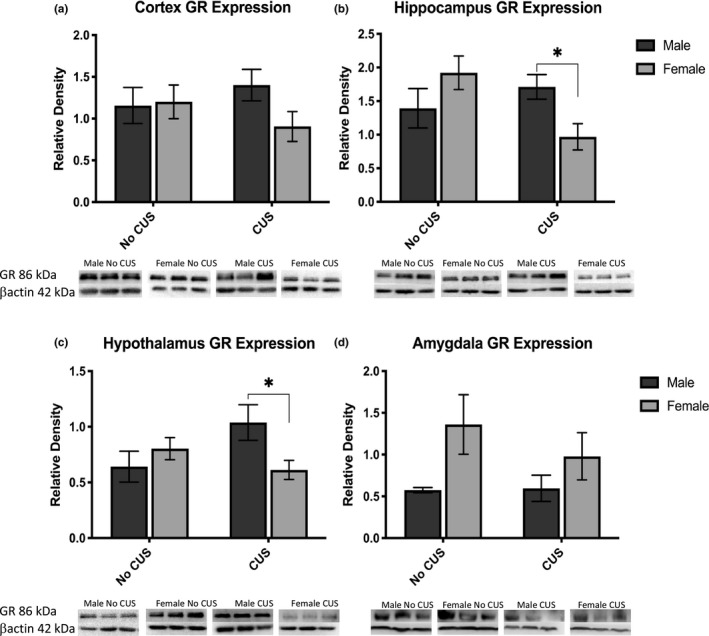
Glucocorticoid receptor expression normalized against bactin. Panels display functionally relevant brain regions of the HPA axis such as the cortex (a), hippocampus (b), hypothalamus (c), and amygdala (d) with respective immunoblots below each graph. *p < .05