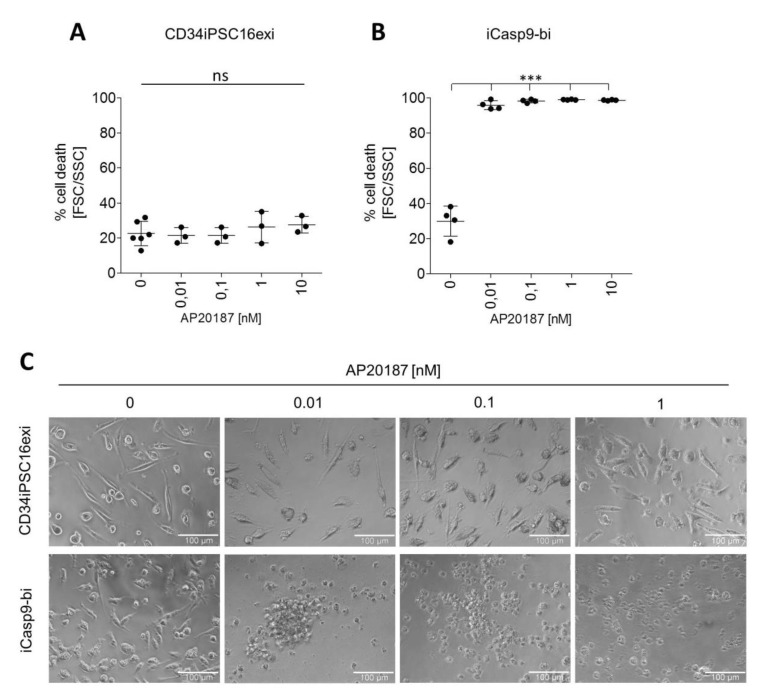
Figure 4.
Induced killing of the iCasp9-expressing iMΦ. Percentage of dead cells according to FSC/SSC gating 24 h after application of 0 to 10 nm AP20187 in CD34iPSC16exi iMΦ (A) and iCasp9-bi iMΦ (B). (mean ± SD, ***P <0.0001, ns—non significant) (C) Phase-contrast imaging of the iMΦ 24 h after treatment with different concentrations of AP20187. (scale bar—100 µm).

