Figure 3.
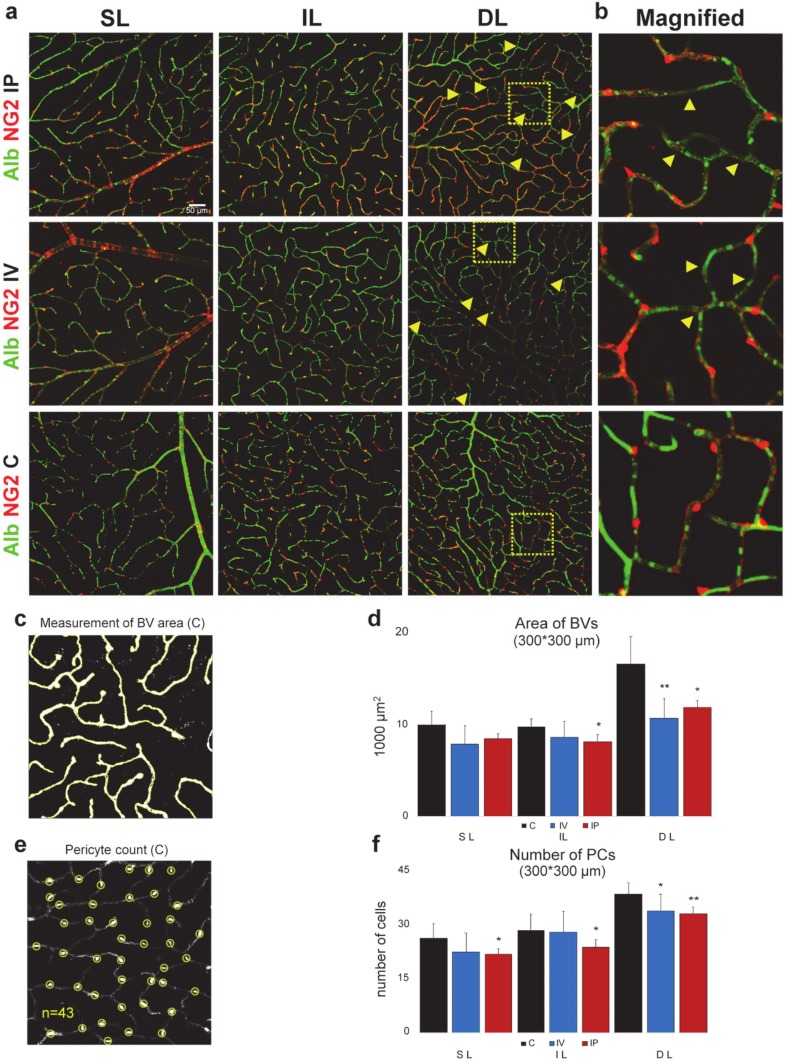
Reduction of PC count and the areal densities of blood vessels following imatinib treatment (a) Confocal images of NG2-DsRed (red) and Albumin (green) labeling (637 × 637 µm) in mouse retinas from each layer (superficial, intermediate, deep: SL, IL, DL). Measurements were made from these original images, layer by layer, in a 300 × 300 µm area in sham-injected, intravitreally injected (2 µL, 8 µg/µL, IV) and intraperitoneally injected (100mg/kg/d, 2 days imatinib, IP) retinas. PC loss is indicated with yellow arrows; we could not see PC loss in the sham-injected controls. Areas indicated by yellow squares are magnified and shown on panel (b). We found no obvious sign of any extravascular albumin label in our imatinib-treated specimen (nor our controls), suggesting that the brain–retina barrier (BRB) remained intact in retinas of these mice. n = 13 (C 5, IV 3, IP 5). An example for (c) determining BV areas and (e) PC numbers. (d) BV areas and PC numbers (f) showed a statistically significant decrease in the IL and DL, suggesting a non-significant decrease in the SL and in the IL of IV animals.

