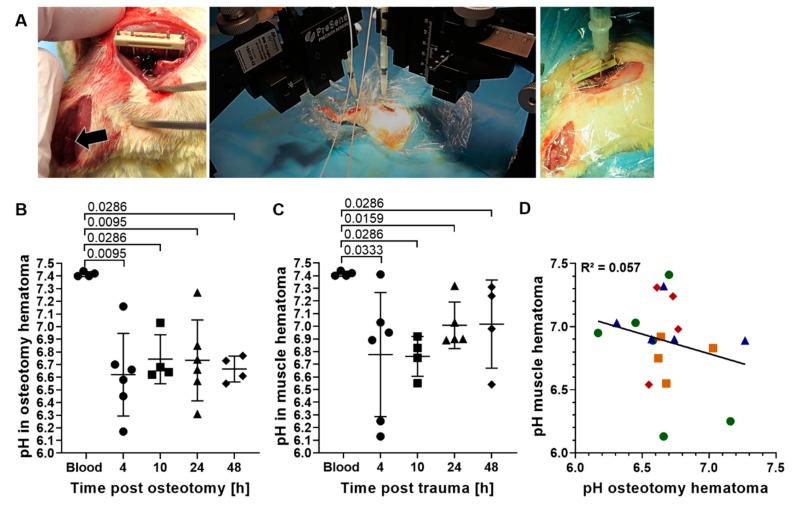
Figure 3.
In vivo pH measurement at 4, 10, 24 and 48 h post osteotomy and muscle trauma. (A) Surgical approach and in vivo pH measurement. From left to right: muscle trauma and Musculus soleus (arrow) and osteotomy with a 5 mm gap size and an external fixation (RISystems); simultaneous and continuous pH measurement within muscle and osteotomy hematoma using optical microsensors (PreSens Precision Sensing) with precise positioning via micromanipulators; close-up image of placement of the pH sensor in the osteotomy hematoma. (B) Scatter plot of individual mean pH of the osteotomy hematoma per time point. (C) Scatter plot of individual mean pH of the hematoma formed after muscle trauma per time point. For (B) and (C): Each value depicted (point per time point) represents the measurement of the respective hematoma for one animal. Mean ± SD is shown for at least four animals per time point. Circles: 4 h, squares: 10 h, triangle: 24 h and rhombus: 48 h time point post injury. Two-way Mann–Whitney U test was performed, comparing the measurement time points to control (blood). (D): Local pH in osteotomy hematoma plotted against local pH in muscle hematoma. Linear regression line is depicted for better visualization. Both parameters (n= 19) passed the D’Agostino–Pearson normality test (α= 0.05, QQ plot depicted in Supplementary Figure S2A). Hence, Pearson correlation was calculated, yielding an R2 value of 0.057. Green circles: 4 h, yellow squares: 10 h, blue triangles: 24 h, and red rhombus: 48 h.

