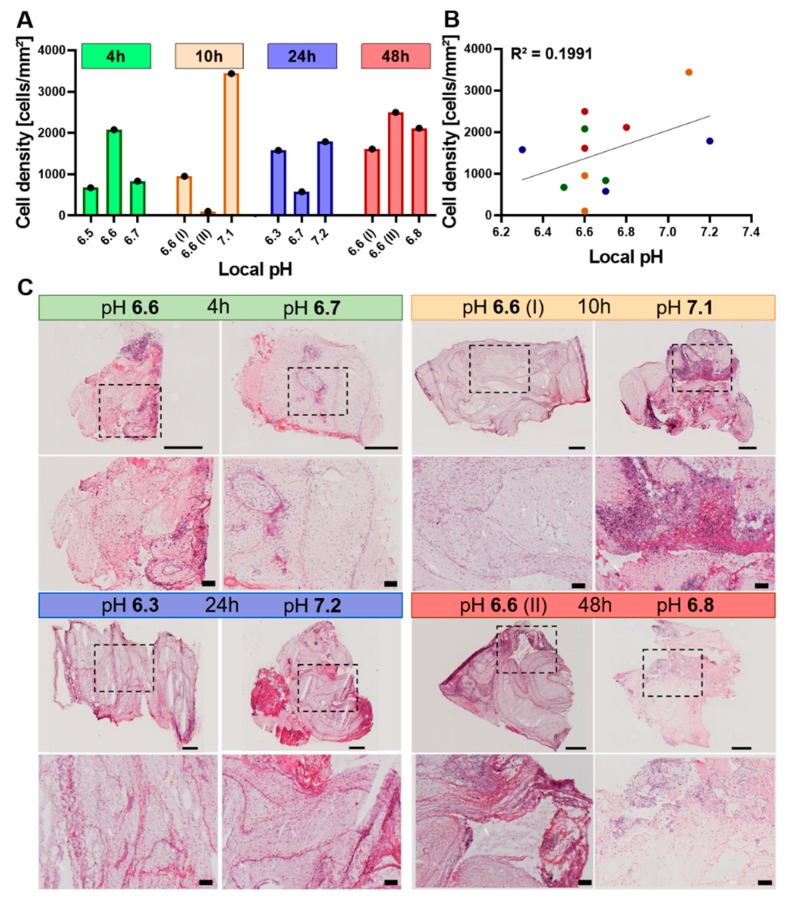
Figure 4.
No direct link between the cellularity of hematoma and pH value. (A) Quantification of cells contained in the H&E-stained sections per mm2 of hematoma grouped by time point and pH (n = 3 for each time point). The total hematoma area was measured in mm2, cells were identified by hematoxylin staining the nuclei and the density was calculated by dividing the total cell count by the total hematoma surface area. (B) Cellular density of all hematomas (4, 10, 24, 48 h) plotted against local pH. Linear regression line is depicted for better visualization. Both parameters passed the D’Agostino–Pearson normality test (α= 0.05, QQ plot depicted in Supplementary Figure S2B,C). Hence, Pearson correlation was calculated, yielding an R2 value of 0.1991. (C) Representative H&E-stained sections of osteotomy hematomas at 4, 10, 24 and 48 h post osteotomy. Samples with a differing pH were chosen as examples for visualization. For each time point, the overview (top panel) and the close-up image (bottom panel) are shown in conjunction with the in vivo measured pH. The dashed box in the overview image indicates the area that is magnified in the bottom panel. Purple dots represent nuclei of cells, whereas the light to strong pink color stains structures such as cytoplasm, proteins and connective tissue. The scale bars indicate 500 µm for the overview image taken at 5x magnification or 100 µm for the close-up image taken at 10x magnification.

