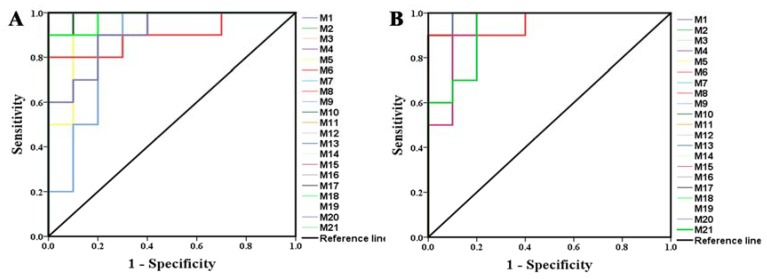
Figure 9.
The predictive receiver operating characteristic (ROC) curves generated using 21 biomarkers contributing to (A) gastric ulcer progress between the model group and the normal group, (B) ocotillol treatment between the model group and H-ocotillol group (the numbers are consistent with No. in Table 1).

