Figure 1.
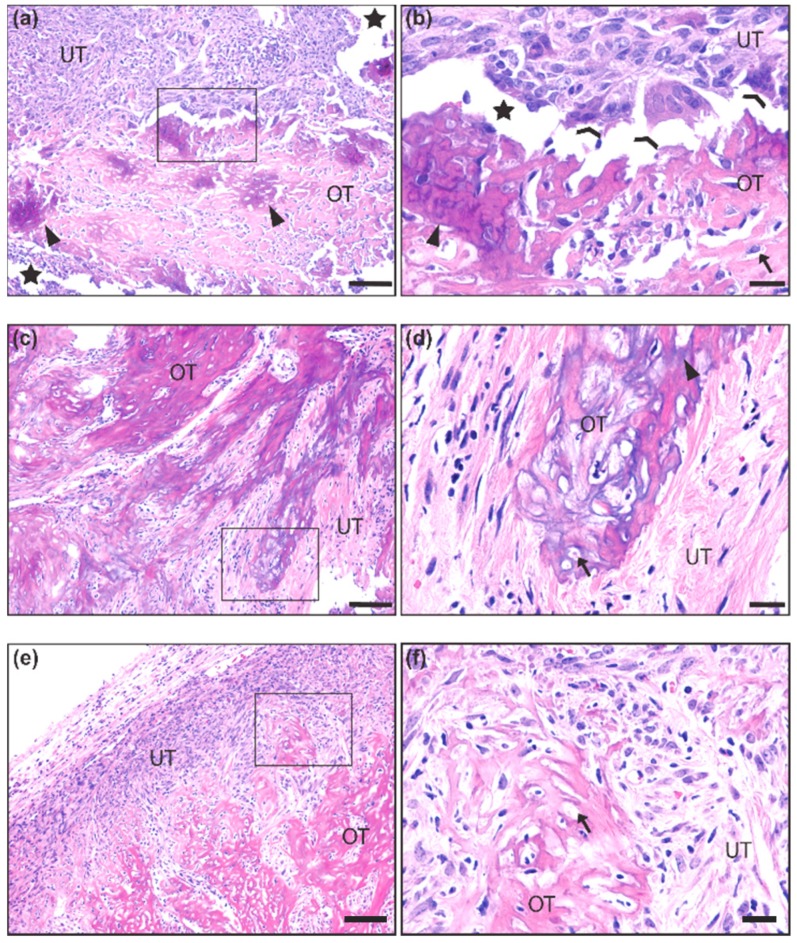
Histological representation of ossification in mouse synovial sarcoma. (a,b) 10× and 40× insert of synovial sarcoma with ossified tumor matrix (OT) exhibiting calcium salt crystals (purple) embedded in osteoid (pink). The unossified tumor matrix (UT) contains sarcoma cells that are more epithelioid in appearance, and two osteoclast-like multinucleated giant cells are seen at the interface of the ossified matrix (c,d) 10× and 40× insert of synovial sarcoma with a more extensively calcified matrix interfaced with spindle-shaped tumor cells that are loosely packed in a fibrous stroma. (e,f) 10× and 40× insert of synovial sarcoma with uncalcified osteoid matrix interfaced with a dense population of spindle-shaped tumor cells embedded in a fibrous stroma. Scale bars in the 10× images = 100 μm, and scale bars in the 40× images = 20 μm. OT = Ossified Tumor, UT = Unossified Tumor, Arrow = lacunae, Arrowhead = calcium salt deposits of ossified tumor matrix, Chevron = osteoclast-like multinucleated giant cells, Star = artificial space at the interface of ossified and unossified tumor matrix.

