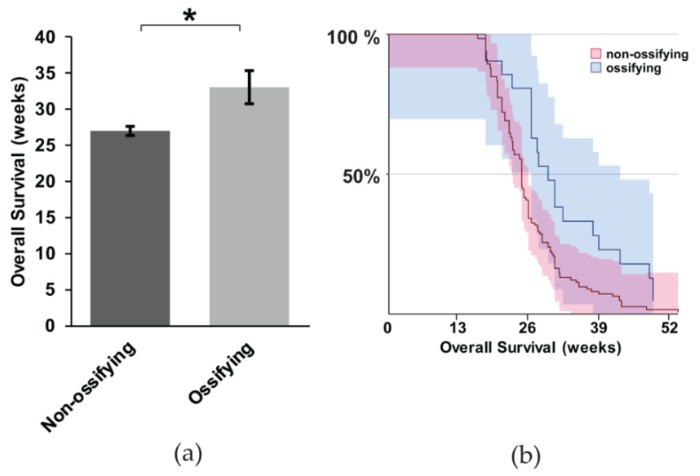
Figure 5.
The correlation between ossification and mouse survival with metastatic synovial sarcoma; (a) Representative bar graph showing the overall survival of non-ossifying (n = 104) and ossifying (n = 20) mice, with statistical significance occurring for the survival of mice exhibiting ossification; (b) Kaplan Meier Survival curve of non-ossifying and ossifying mice. Shaded area represents 90% CI. * p < 0.05.

