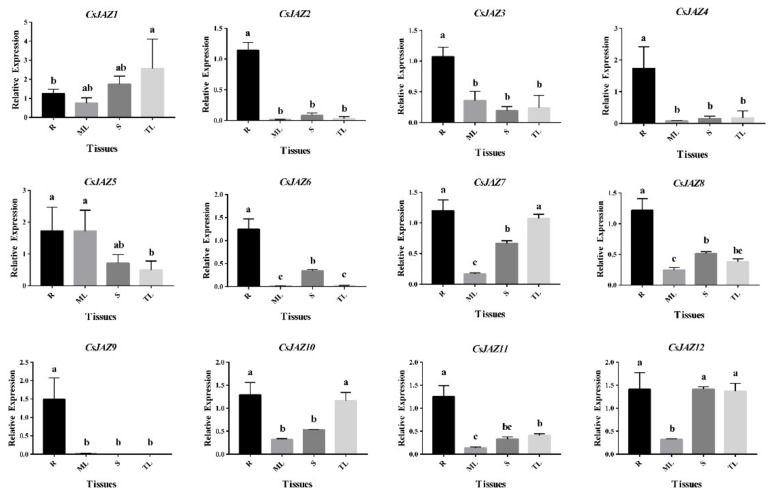
Figure 3.
Quantitative RT–PCR analysis of expression of CsJAZ genes in different tea tissues. Data presented in the quantitative RT–PCR analysis were mean values and standard deviation of three biological replicates of different tissues and three technical replicates in each biological sample. The y-axis is the relative expression level. The different lower case letters above bars indicated the signifcance (p < 0.05) of the relative expression level between two samples. R: roots; ML: mature leaves; S: stems; TL: tender leaves.

