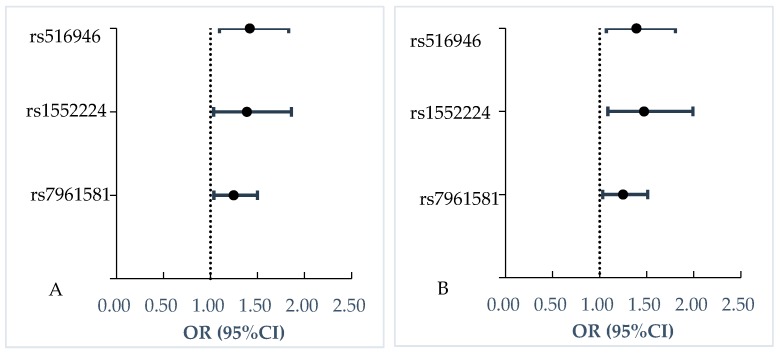
Figure 2.
Association of three SNPs with impaired insulin release. (A) Model 1 was logistic regression model to analyze the association of individual SNP with quantitative traits without adjusting for any covariates. (B) Model 2 was logistic regression model to analyze the association of individual SNP with quantitative traits adjusting for gender, economical status, education levels, BMI, waist circumference, sedentary time, exercise, whole cereal and beans intake levels, livestock and poultry intake levels, drinking, and smoking.

