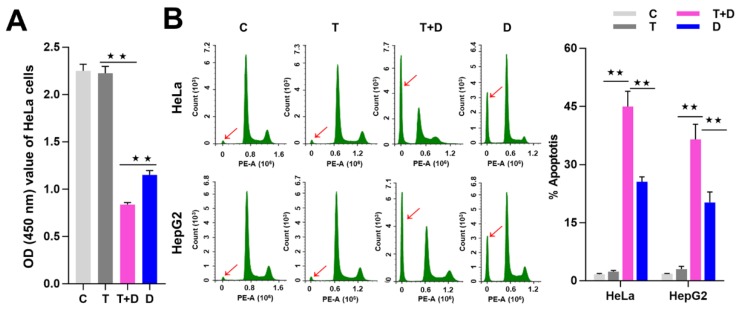
Figure 8.
TNFα promotion of apoptosis induced by DOX. (A) Detection of the cell viability by CCK8 assay. (B) Detection of cell apoptosis by flow cytometry (FCM) assay. The sub-G1 peaks of FCM assay were labeled with red arrows. The average apoptotic rates of three FCM detections were shown by histogram. The data are presented as the means ±SD from three independent experiments. C, control cells; T, TNFα-treated cells; T+D, TNFα&DOX-treated cells; D, DOX-treated cells. The significance of the difference was analyzed by one-way ANOVA. * p < 0.05; ** p < 0.01.

