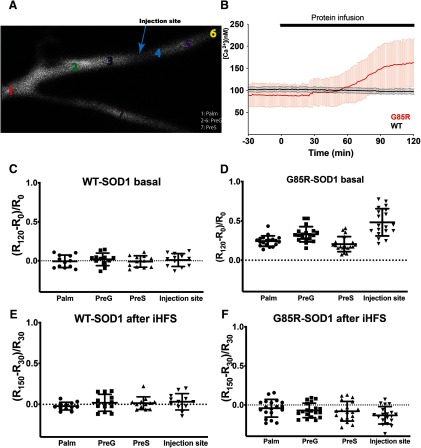
Figure 5.
Presynaptic infusion of G85R-SOD1-His increased Ca2+ levels in the presynaptic terminal. Ratiometric live Ca2+ imaging was performed every 30 s after electrophoretic (100 nA current) infusion of a Ca2+ indicator, 1 mM fura-2 in 100 mM KCl, into the presynaptic axon through the first presynaptic stimulation electrode inserted into the palm (Fig. 1A). Fura-2 injection continued for 10 min, and the synapse was allowed to equilibrate for 30 min before SOD1 injection through the second electrode to ensure fura-2 was diffused evenly throughout the whole presynaptic terminal at roughly 100 μM. Ratiometric images were taken at Ex360 nm and Ex390 nm assisted by ultra-high-speed wavelength switching λ DG-4/5 xenon arc lamp system. Ratios at various locations (A) were calculated as (fluorescent intensity360nm)/(fluorescent intensity390nm) to provide a measure of intracellular Ca2+ concentrations. The blue arrow indicates the injection site for SOD1 proteins. 1: palm, 2–6: PreG, 4: infusion site, 7: PreS, an adjacent presynaptic axon branch which is smaller in size. B, G85R-SOD1-His induced Ca2+ increases while WT-SOD1-His had no effect on Ca2+ concentration. Raw Ca2+ concentrations were derived from the equation [Ca2+] = and averaged across 12 WT- and 19 G85R-SOD1-injected presynaptic terminals (PreG) respectively. Kd′, Rmin, and Rmax were calculated from standards as described in Materials and Methods. Although different synapses varied in their baseline Ca2+ concentrations, G85R consistently increased [Ca2+] at around 60 min after protein injection whereas WT had no effect. C, D, Baseline normalized Ca2+ ratio defined as (R120 – R0)/R0 (R120: 60 min after SOD1 injection, R0: before SOD1 injection) were plotted at four sites for WT (n = 12) and G85R (n = 19). G85R-SOD1 caused increases in [Ca2+] at all sites including the palm where Ca2+ channels are sparse or absent. The increase in [Ca2+] correlated roughly with G85R-SOD1 concentration, with the highest levels at the injection site and lowest in PreS, a smaller presynaptic axonal branch infused with fura-2 at a comparable concentration but with a lower SOD1 concentration due to slower diffusion from the injection site in PreG. E, F, iHFS applied at 30 min after SOD1 injection seemed to restore Ca2+ homeostasis in G85R-SOD1-injected synapses (n = 19), and this equilibrium lasted at least 2 h after iHFS, similar to that in WT (n = 12), this suggested the possibility that redistribution of Ca2+ is induced by iHFS. As expected, Ca2+ levels increased during HFS in synapses infused with either WT or G85R-SOD1 proteins (Extended Data Fig. 5-1).

