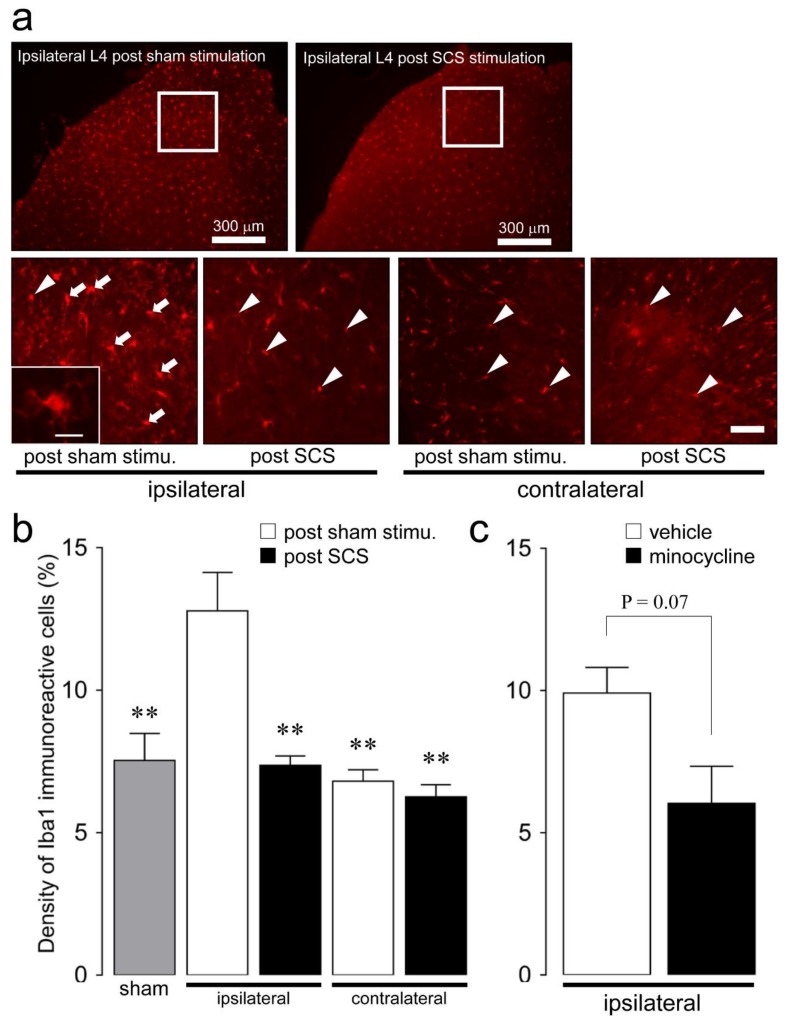
Figure 3.
Changes in the L4 dorsal horn microglial activation on day 3 following SNI depending on SCS. (a) Iba1-immunoreactive (IR) cells in the bilateral L4 dorsal horn on day 3 following SNI with SCS or sham stimulation. White frame indicates the density analysis area. Arrows indicate activated Iba1-IR cells. Arrowhead indicates non-activated Iba1-IR cells. Scale bar: 100 µm. Inlet in (a) low and high magnification fluorescence micrograph of the activated Iba1-IR cells. Scale bar: 50 µm. (b) The bilateral density of Iba1-IR cells in the L4 dorsal horn on day 3 after SNI with SCS or sham stimulation, and in sham-injured rat-treated sham stimulation. Error bars indicate SEM. ** p < 0.01 vs. post-sham stimulation (one-way ANOVA with Tukey’s multiple-comparison test). (c) The ipsilateral density of Iba1-IR cells in the L4 dorsal horn on day 3 after SNI with once-daily i.p. vehicle (saline) or minocycline (30 mg/kg/day) administration. Error bars indicate SEM. (Student’s t-test).

