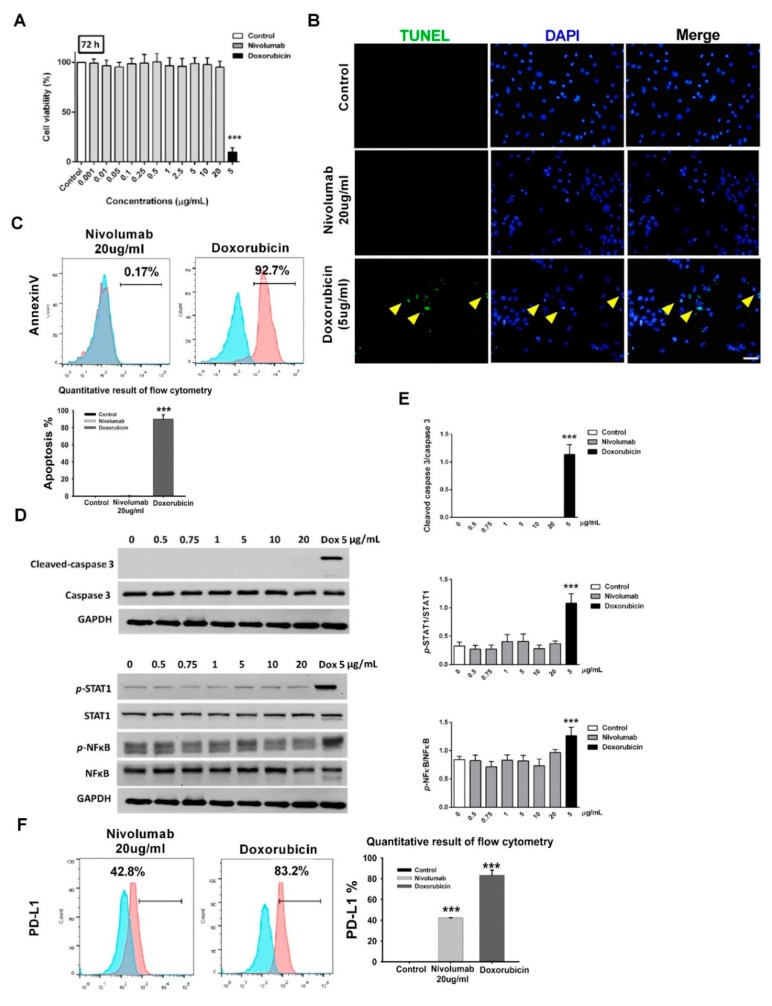
Figure 2.
Effects of nivolumab on cell viability in RUES2-CMs. (A) The effect of nivolumab on cell viability was determined by an MTT assay. Positive control (doxorubicin 5 μg/mL) was provided. *** p < 0.001 versus control (n = 3). (B) Representative images of the TUNEL staining of cardiomyocytes. TUNEL staining was used to detect cell apoptosis (green). The nuclei were counterstained with DAPI (blue). Cyan color represents TUNEL-positive nuclei on merged photos. Positive control (doxorubicin 5 μg/mL) was provided. Scale bar: 50 μm. (C) Representative flow cytometry images of the Annexin V. Positive control (doxorubicin 5 μg/mL) was provided. *** p < 0.001 versus control (n = 3), one-way ANOVA, posthoc Bonferroni test. (D) Representative western blot analysis of caspase3 and inflammation markers—STAT1, NFkB—and the quantitative result (E). Positive control (doxorubicin 5 μg/mL) was provided. *** p < 0.001 versus control (n = 3), one-way ANOVA, posthoc Bonferroni test. Data are shown as the mean ± SD. RUES2-CM, Rockefeller University embryonic stem cell line 2- cardiomyocytes. (F) The PD-L1 expression level in RUES2-CMs analyzed by flow cytometry images. The quantitative result is shown in the right panel. *** p < 0.001 versus control (n = 3), one-way ANOVA, posthoc Bonferroni test.

