Figure 3.
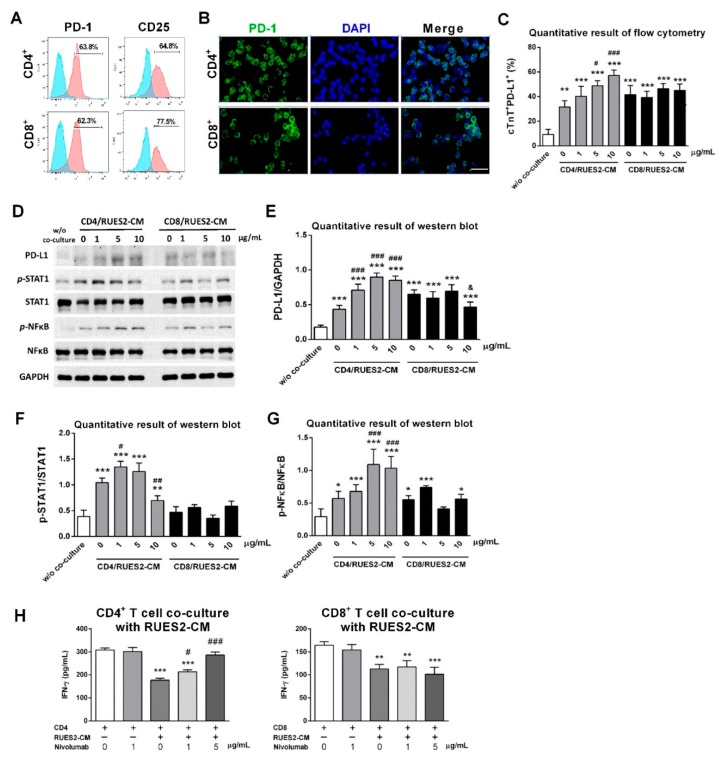
Validation of PD-1 expression on CD4+ and CD8+ T lymphocytes. (A) Representative flow cytometry results of PD-1 and activation marker CD25 expression on CD4+ and CD8+ T lymphocytes after anti-CD3/CD28 stimulation. PD-1, programmed death-1. (B) Representative micrographs showing immunostained PD-1+ cells (green) on the CD4+ and CD8+ T lymphocytes. Scale bar: 50 μm. (C) Quantification of cTnT+/PD-L1 expression by flow cytometry analysis of levels of cTnT+/PD-L1 expression on RUES2-CMs co-cultured with CD4+ and CD8+ T lymphocytes with nivolumab treatment at different doses. ** p < 0.01, *** p < 0.001 versus RUES2-CMs alone group; # p < 0.05, ### p < 0.001 versus CD4/RUES2-CMs human IgG4 isotype control (w/o co-culture) group (n = 3). (D) Representative western blot analysis on RUES2-CMs co-cultured with CD4+ and CD8+ T lymphocytes containing nivolumab treatment with different doses and quantitative results (E–G). * p < 0.05, ** p < 0.01, *** p < 0.001 versus RUES2-CMs alone group; # p < 0.05, ## p < 0.01, ### p < 0.001 versus CD4/RUES2-CMs human IgG4 isotype control (w/o co-culture) group (n=3; & p < 0.05 versus CD8/RUES2-CMs human IgG4 isotype control (w/o co-culture) group; & p < 0.05, versus CD8/RUES2-CMs human IgG4 isotype control (w/o co-culture) group (n = 3), one-way ANOVA, posthoc Bonferroni test. (H) Quantitative result of ELISA assay, showing production of IFN-γ in CD4+ T lymphocytes/RUES2-CMs and CD8+ T lymphocytes/RUES2-CMs co-culture medium. ** p < 0.01, *** p < 0.001 versus CD4+ T lymphocytes alone group; # p < 0.05, ### p < 0.001 versus CD4/RUES2-CMs human IgG4 isotype control (w/o co-culture) group (n = 3).

