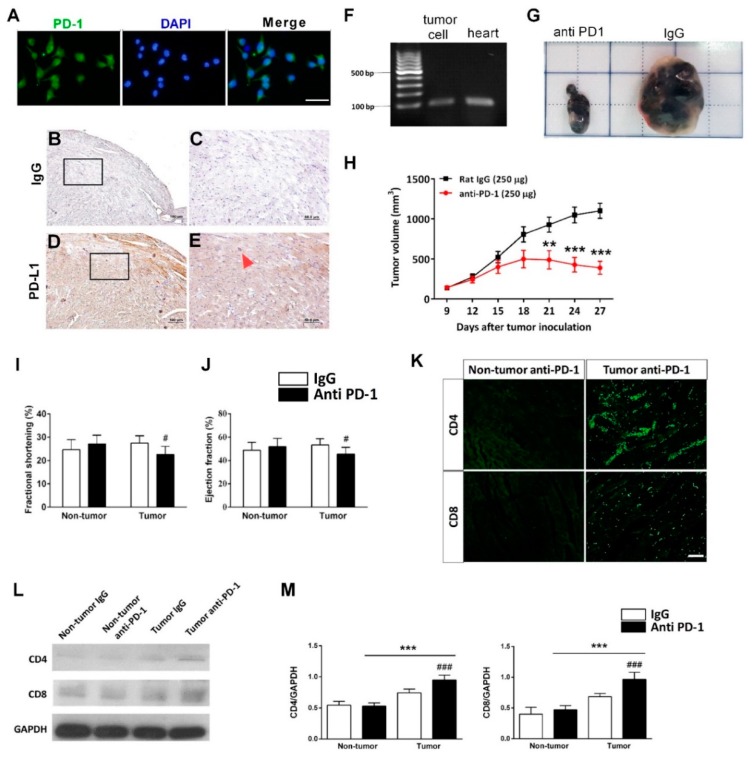
Figure 4.
Effects of anti-PD-1 immunotherapy on tumor growth in tumor-bearing mice. (A) Representative micrographs showing immunostained PD-L1+ cells (green) on the B16-F10 cells. Scale bar: 50 μm. Representative immunohistochemistry staining for IgG (B,C) and PD-L1 (D,E) on mouse heart. The inset box, showing the enlarged pictures for the indicated square area. Scale bars in (B) and (D), 100 μm; scale bars in (C) and (E), 50 μm. Red arrow: PD-L1+ cell. (F) Representative PCR analysis of PD-L1 in B16-F10 cells and mouse heart. PD-L1, programmed death-ligand 1. (G) Representative photograph of xenograft tumors at the end of the experiment. (H) Tumor growth curves for each experiment group. ** p < 0.01, *** p < 0.001 versus rat IgG group (n = 7), two-way ANOVA, posthoc Bonferroni test. Effects of anti-PD-1 immunotherapy on mouse heart function. The quantitative data of fractional shortening (I), and ejection fraction (J) of rat IgG and anti-PD-1-treated group. # p < 0.05 versus rat IgG-treated tumor group (n = 7); # p < 0.05 versus anti-PD-1-treated non-tumor group (n = 7). (K) Representative micrographs showing immunostained CD4+ and CD8+ cells (green) in the myocardium. Scale bar: 1000 μm. (L) Representative western blot analysis and quantitative results (M). *** p < 0.001 versus anti-PD-1-treated non-tumor group; ### p < 0.001 versus rat IgG-treated tumor group (n = 4), two-way ANOVA, posthoc Bonferroni test. Data are shown as the mean ± SD.

