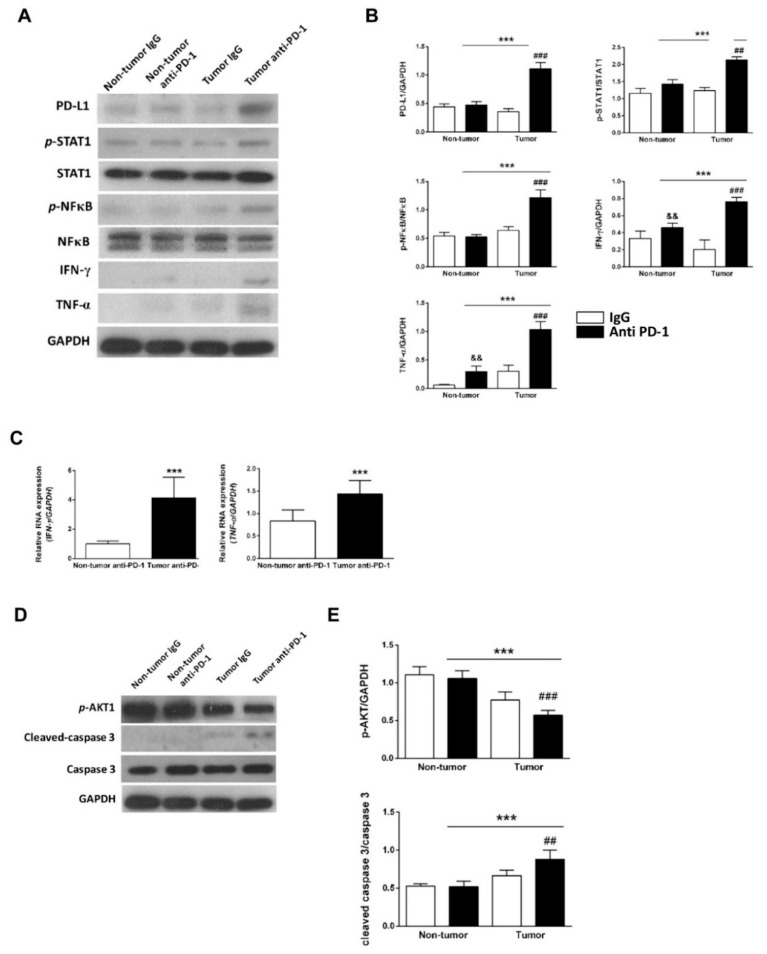
Figure 5.
Effects of anti-PD-1 immunotherapy on the expression of PD-L1 and inflammation-related markers in tumor-bearing mice. (A) Representative western blot analysis and quantitative results (B). && p < 0.01, ### p < 0.001 versus rat IgG-treated tumor group; *** p < 0.001 versus anti-PD-1-treated non-tumor group; && p < 0.01 versus rat IgG-treated non-tumor group (n = 4), two-way ANOVA, posthoc Bonferroni test. (C) A representative of RT-PCR analysis of IFN-γ and TNF-α in the anti-PD-1-treated non-tumor group and anti-PD-1-treated tumor group. *** p < 0.001 versus anti-PD-1-treated non-tumor group (n = 4), unpaired Student’s t-test. Data are shown as the mean ± SD. (D) Representative western blot analysis of apoptosis markers and quantitative results (E). ## p < 0.01, ### p < 0.001 versus rat IgG-treated tumor group; *** p < 0.001 versus anti-PD-1-treated non-tumor group (n = 4), two-way ANOVA, posthoc Bonferroni test.

