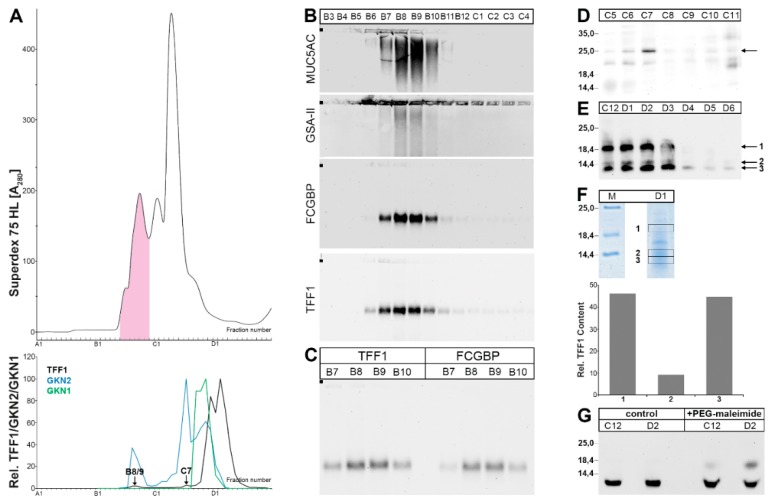
Figure 1.
Analysis of human gastric corpus extract (MC-383; homogenized in a mortar). (A) Elution profile after size exclusion chromatography (SEC) on a Superdex 75 HL column, as determined by absorbance at 280 nm (periodic acid-Schiff (PAS)-positive mucin fractions: pink). Underneath: Distribution of the relative TFF1 (black), GKN2 (blue), and GKN1 (green) content as determined by Western blot analysis under reducing conditions and semi-quantitative analysis of the typical monomeric band intensities. (B) 1% agarose gel electrophoresis (AgGE) and subsequent Western blot analysis of the fractions B3-C4 concerning MUC5AC, MUC6 (lectin GSA-II), FCGBP, and TFF1. The start is marked with a dot on the left. (C) 1% AgGE and subsequent Western blot analysis of the fractions B7-B10 concerning TFF1 and FCGBP, respectively. (D) 15% sodium dodecyl sulfate-polyacrylamide gel electrophoresis (SDS-PAGE) (non-reducing conditions) and subsequent Western blot analysis of fractions C5-C11 concerning TFF1 (post-reduction step on the membrane). The molecular mass standard is indicated on the left. (E) 15% SDS-PAGE (non-reducing conditions) and subsequent Western blot analysis of fractions C12-D6 concerning TFF1 (post-in-gel-reduction). (F) 15% SDS-PAGE (non-reducing conditions) and Coomassie staining of fraction D1 (M: marker). Then, proteins were eluted from the bands 1, 2, and 3, subjected to reducing 15% SDS-PAGE, and the TFF1 content was measured by semi-quantitative Western blot analysis. (G) 15% SDS-PAGE (reducing conditions) and Western blot analysis concerning TFF1 of fractions C12 and D2 with or without polyethylene glycol (PEG)-maleimide treatment.

