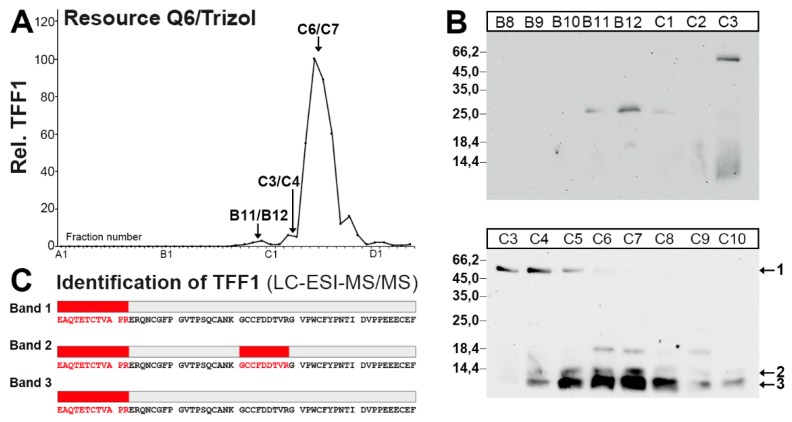
Figure 4.
Purification of the 60k-band and monomeric forms of TFF1 from a human gastric corpus extract (MC-577) after TRIzol® extraction, and characterization by LC-ESI-MS/MS analysis. (A) Anion-exchange chromatography on a Resource Q6 column of a human gastric extract (MC-577) after TRIzol® extraction. Shown is the distribution of the relative TFF1 immunoreactivity in the fractions as determined by Western blot analysis under reducing conditions and semi-quantitative analysis of the typical monomeric band intensities. (B) 15% SDS-PAGE (non-reducing conditions) and subsequent Western blot analysis of the fractions B8-C10 concerning TFF1 (post-in-gel reduction). Marked are the band at 60k (band 1) and the monomeric bands 2 and 3. The molecular mass standard is indicated on the left. (C) Fractions C3/C4 and C6/C7 respectively, were concentrated, desalted, separated by non-reducing 15% SDS-PAGE followed by Coomassie staining, and the regions corresponding to bands 1–3 were excised and subjected to LC-ESI-MS/MS analysis. Shown are the results of the LC-ESI-MS/MS analysis after tryptic in-gel digestion of the bands 1–3. Identified tryptic peptides belonging to TFF1 are shown in red.

