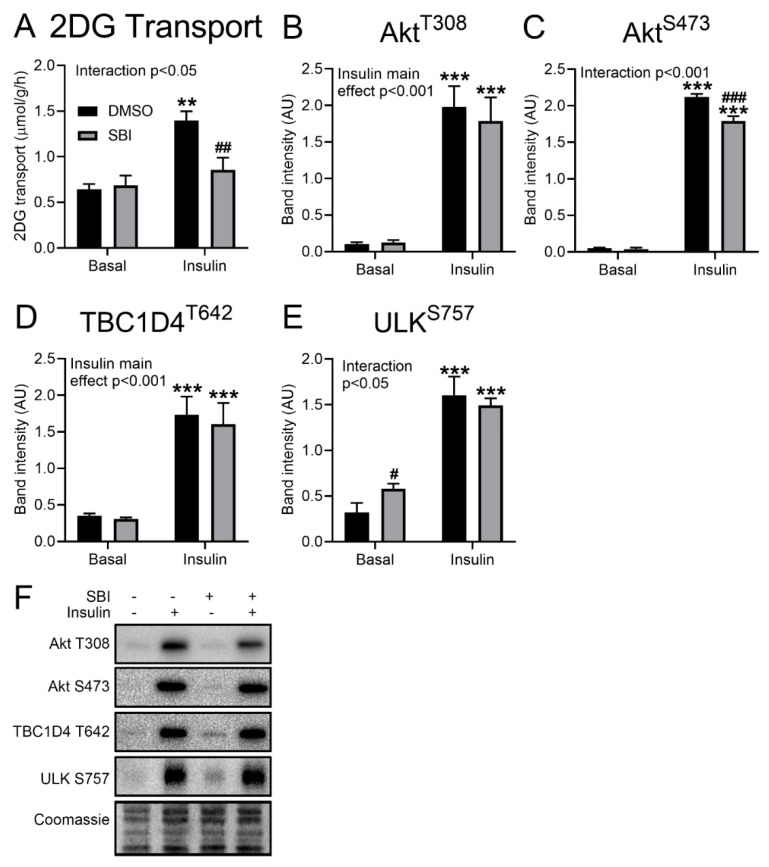
Figure 3.
SBI-0206965 inhibits insulin-stimulated glucose transport. Quantification of (A) glucose transport and (B) Akt Thr308, (C) Akt Ser473, (D) TBC1D4 Thr642, and (E) ULK Ser757 phosphorylation in soleus muscles stimulated with or without insulin (60 nM, 20 min) and with or without 10 µM SBI-0206965 for 1 h. (F) Representative blots of quantified and total proteins. ANOVA main or interaction effects are indicated in the panels. **/*** p < 0.01/0.001 vs. Basal, #/##/### p < 0.05/0.01/0.001 vs. DMSO. n = 3. All values are shown as mean ± SEM.

