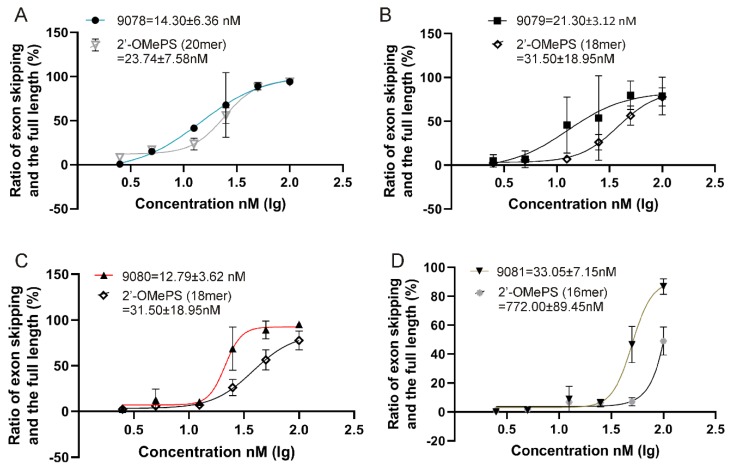
Figure 7.
Evaluation of half maximal effective concentration (EC50) of the AOs vs. their corresponding 2′-O-methyl phosphorothioate (2′-OMePS) control AO (Error bars represent the standard deviation of mean). (A) NAC 9078 vs 2′-OMePS control AO (20mer); (B) NAC 9079 vs 2′-OMePS control AO (18mer); (C) NAC 9080 vs 2′-OMePS control AO (18mer); (D) NAC 9081 vs 2′-OMePS control AO (16mer).

