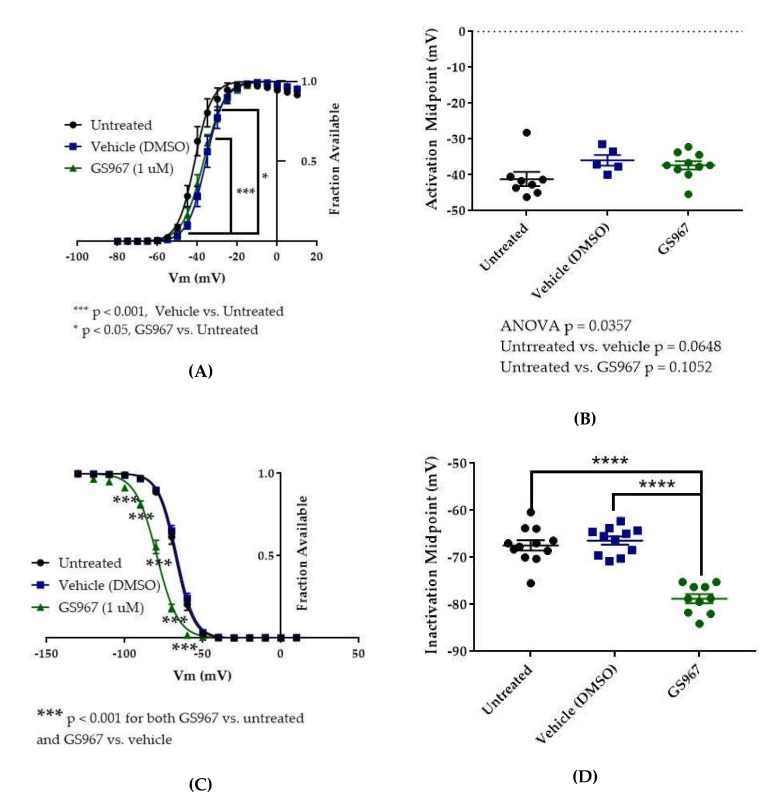
Figure 8.
Effects of GS967 on WT hNav1.2 gating in stable HEK cell lines. (A) Activation curves. Conductance was calculated as G/Gmax, where G = I/(Vm-Vrev), Vrev = reversal potential, and Gmax = maximum inward conductance across all tested voltages. Significance was determined by two-way ANOVA with Tukey’s multiple comparisons. ***p < 0.0001, vehicle vs. untreated, *p < 0.05, GS967 vs. untreated. n = 8 untreated, 5 vehicle, 10 GS967. (B) The estimated activation midpoint for each cell is plotted; average and SEM for each group is indicated by bars. Significance was determined by Kruskal–Wallis test with Dunn’s multiple comparisons. n = 8 untreated, 5 vehicle, 10 GS967. (C) Inactivation curves. Fraction available was calculated as I/Imax for each cell at each voltage step. Significance was determined by two-way ANOVA with Tukey’s multiple comparisons. ***p < 0.001, GS967 vs. untreated and GS967 vs. vehicle. n = 12 untreated, 11 vehicle, 10 GS967. (D) The estimated inactivation midpoint for each cell is plotted; average and SEM for each group is indicated by bars. Significance was determined by one-way ANOVA with Tukey’s multiple comparisons. n = 12 untreated, 11 vehicle, 10 GS967. **** p < 0.0001.

