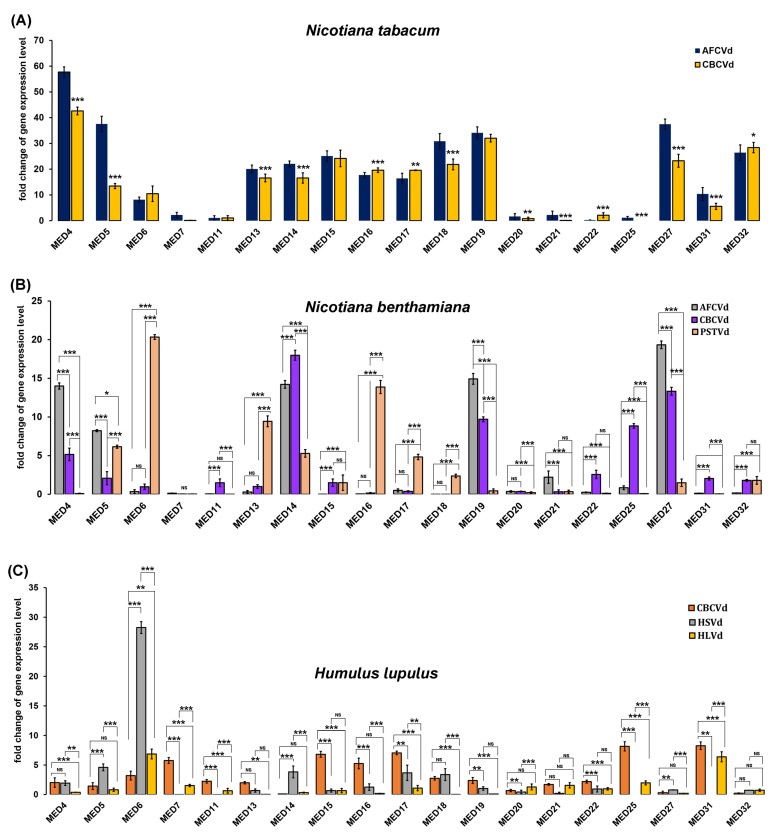
Figure 2.
Reverse transcriptase quantitative real-time PCR (RT-qPCR)-based expression profiling of selected mediator subunits in response to the viroid infection in N. tabacum (A), N. benthamiana (B) and hop (C) plants. RT-qPCR analyses were normalized using DRH1 as an internal control gene and the fold change in each gene in viroid infected/transformed plants was calculated with respect to mock-inoculated control plants by the (2−ΔΔCt) method. The data were obtained from three independent experiments; bars show ± SD. Comparison between groups was assessed by a two-way ANOVA followed by Tukey’s test, an asterisk denotes statistically significant differences (* p < 0.1, ** p < 0.05, and *** p < 0.01).

