Figure 5.
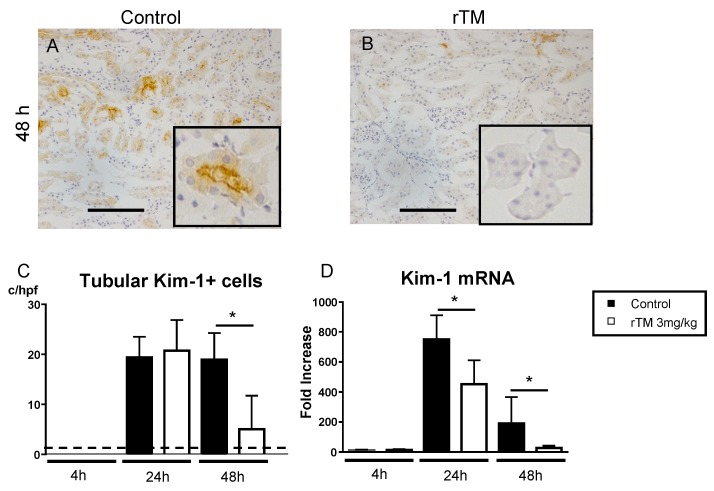
Expression of Kim-1 (kidney injury molecule-1) in the kidney. Representative photograph of Kim-1 expression in the kidney after lipopolysaccharide (LPS) injection (A,B). In saline-treated control mice, Kim-1-positive tubules were present in the kidney (A). Kim-1-positive tubules were significantly visible in the rTM-treated mice, whereas they were not visible in the control mice (B). The number of Kim-1-positive tubules in 10 × 400 fields (C). Expression of renal Kim-1 mRNA is shown (D). The panels show mean numbers and fold increase ±standard error of the mean (* p < 0.05, control mice versus rTM-treated mice). c/10 hpf, cell numbers per 10 high-power fields. Dotted lines represent mean values from control mice without LPS. Scale bar, 50 μm.

