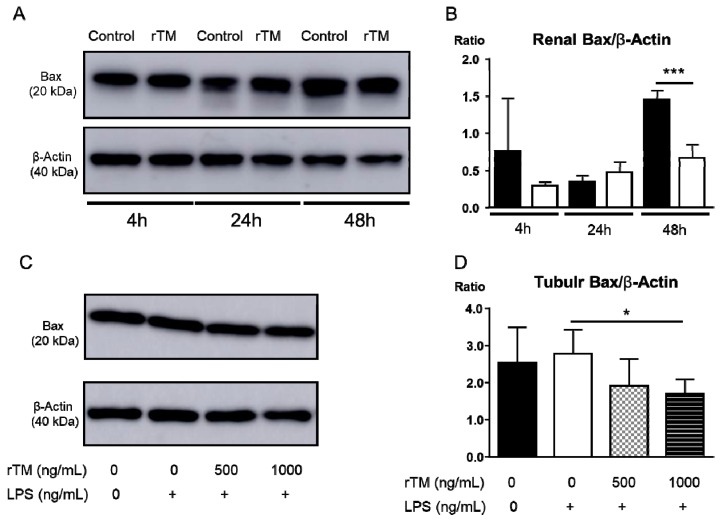
Figure 7.
Expression of Bax in the kidney and tubular epithelial cells by Western blotting in vivo and in vitro. Representative photographs show Bax expression in the kidney and tubular epithelial cells (TECs) (A,C). The ratio of Bax/β-actin in the kidney after lipopolysaccharide (LPS) injection was analyzed at 4, 24, and 48 h (B). The ratio of Bax/β-actin in the TECs added with rTM (0, 500, and 1000 ng/mL) in the presence of LPS (300 ng/mL) was analyzed for 24 h (each goup; n = 4) (D). The data are the mean ± standard error of the mean (*** p < 0.001, control versus rTM-treated mice and * p < 0.05, LPS 300 ng/mL alone versus rTM 1000 ng/mL + LPS 300 ng/mL).

