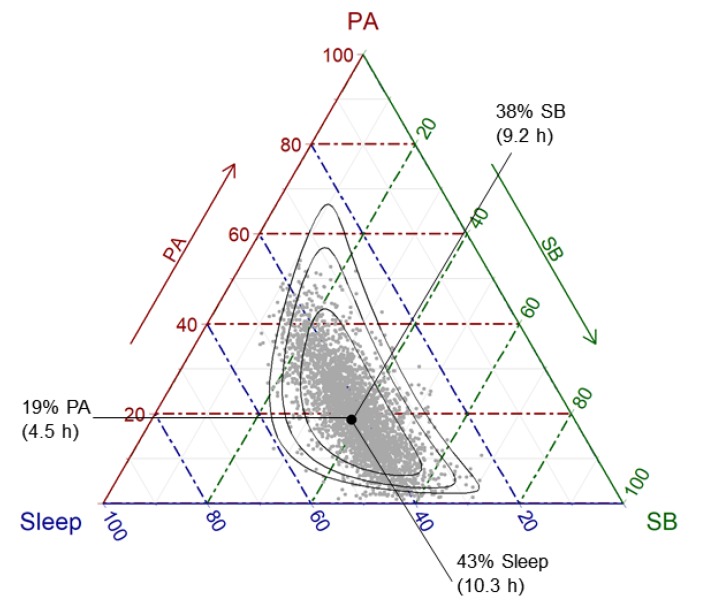
Figure 1.
The ternary diagram: The Simplex sample space for a three-part composition is a triangle. Time-use data are from the Longitudinal Study of Australian Children, birth cohort, Wave 6. Black dot represents the compositional center of the time-use dataset, surrounded by 75%, 95% and 99% predictive regions from fitting a logratio normal distribution, which reflects the relative scale of compositional data [31] (see Section 3.1 for further details). PA = physical activity; SB = sedentary behavior.

