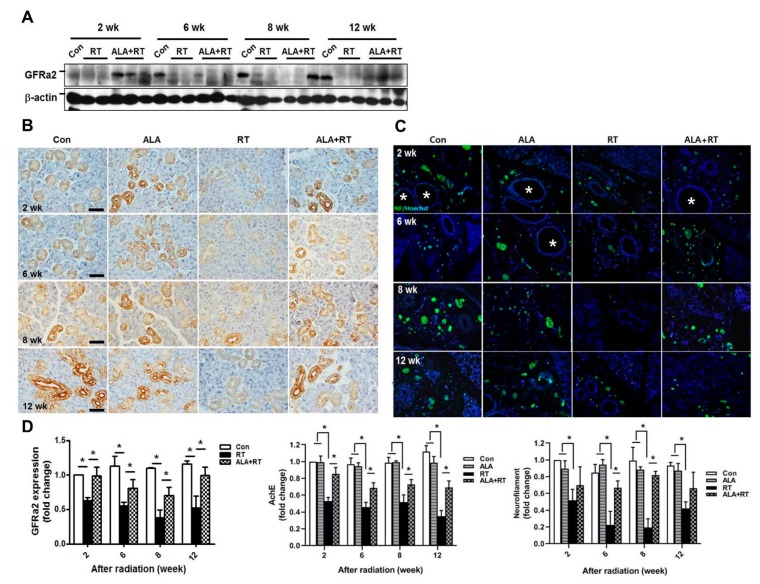
Figure 3.
ALA rescues parasympathetic innervation in SGs. Sprague–Dawley rats were subjected to 18 Gy radiation in the head and neck region. (A) SGs were collected at each time points after radiation and subjected to Western blotting of GFRα2. β-actin was used as the loading control. The expression of GFRa2 is normalized to β-actin, was shown as signal intensity, and the expression in each group was represented as fold change. The fold change is calculated as the ratio of the final value in each group to the value in control group at 2 weeks (set as “1”). Size markers mean 50 kDa. Con; control (n = 3). RT; irradiation only group (n = 4). ALA+RT; ALA plus irradiation groups (n = 3). The immunohistochemical staining of AchE (brown in (B) and neurofilaments (C) was shown in representative images. * indicate the ducts in SGs in C. Scale bar, 50 μm. N = 3–4 SGs/group. (D) Western blot and positive signals for each target were calculated as signal density. Values are represented as the mean ± SEM. *p < 0.05.

