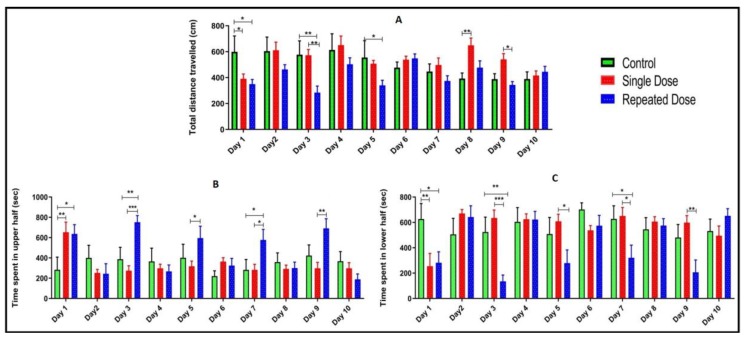
Figure 4.
Total distance travelled, time spent in upper and lower half of the tank. All the values are expressed as mean ± SEM, and each data point shows the average of ten fish in each group (n = 10). Statistical analysis was carried out using two-way ANOVA, p < 0.05 was considered significant, *p < 0.05, **p < 0.01, ***p < 0.001. Total distance travelled in a tank (A), time spent in upper half (B), and time spent in lower half (C).

