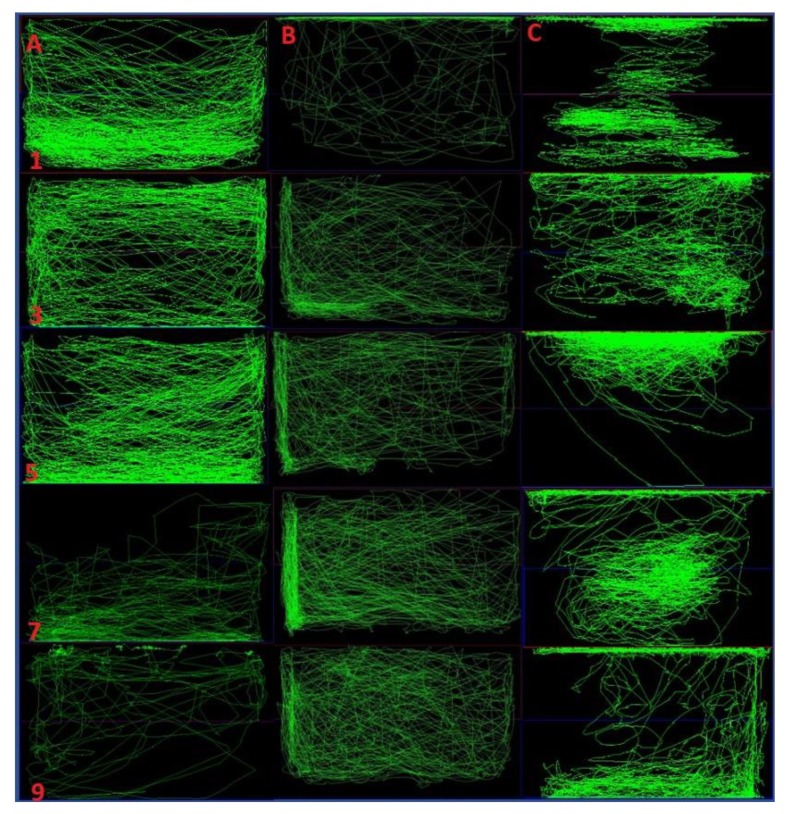
Figure 5.
Comparison of locomotor pattern and behavior of fish. Single dose and repeated dose of pilocarpine treatment versus normal control. Representative swimming patterns (behavior recording) for the corresponding three experimental groups (A–C). The swimming pattern for the group (A) represents the 10% DMSO only vehicle control. The swimming pattern for the group (B) represents the single dose of Pilocarpine (400 mg/kg) whereas the swimming pattern for the group (C) represents the repeated dose of Pilocarpine (400 mg/kg) for 10 days. The number in the rows represents the swimming pattern of the specific day (1, 3, 5, 7, 9).

