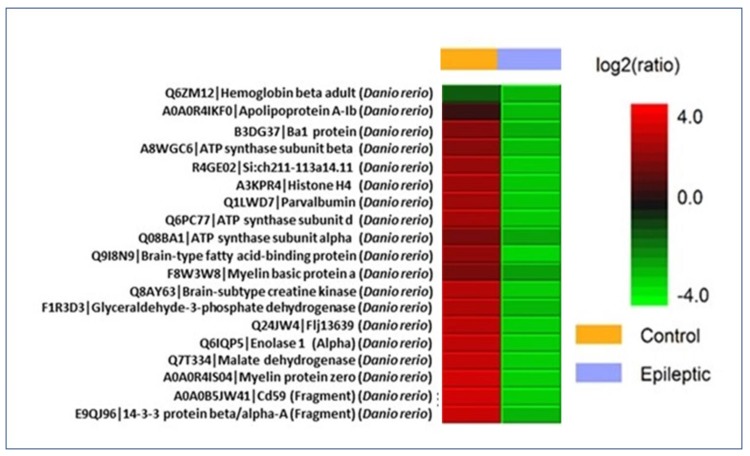
Figure 8.
Differential expression (LFQ) of normal vs. epileptic zebrafish brain protein extract denoted by heat map. Label free quantification heat map for proteins identified from zebrafish brain (control vs. epileptic). Proteins with high ratio and low ratio are labelled red and green respectively. Samples are taken in triplicate where yellow line denotes epileptic group and light blue line denotes normal control group.

