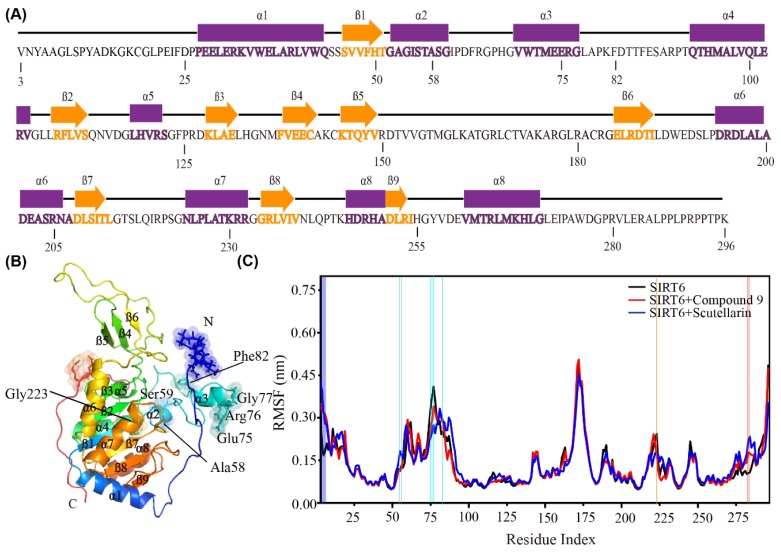
Figure 2.
The effect of inhibitors on the flexibility of the residues. (A) The sequence of SIRT6 (PBD ID: 3K35). Strands are represented by orange arrows and helices are shown as purple cylinders. (B) The 3D structure of SIRT6 in the new cartoon representation. The flexible residues are shown as sticks and spheres. (C) The analysis of the average Cα root mean square fluctuations (RMSFs) of SIRT6 in the three systems. The big difference of RMSFs are symbolized with the light blue line (α2), cyan line (α3), orange line (α7), dark blue line (N terminus) and red line (C terminus) according to the domain of SIRT6 are given in vertical direction.

