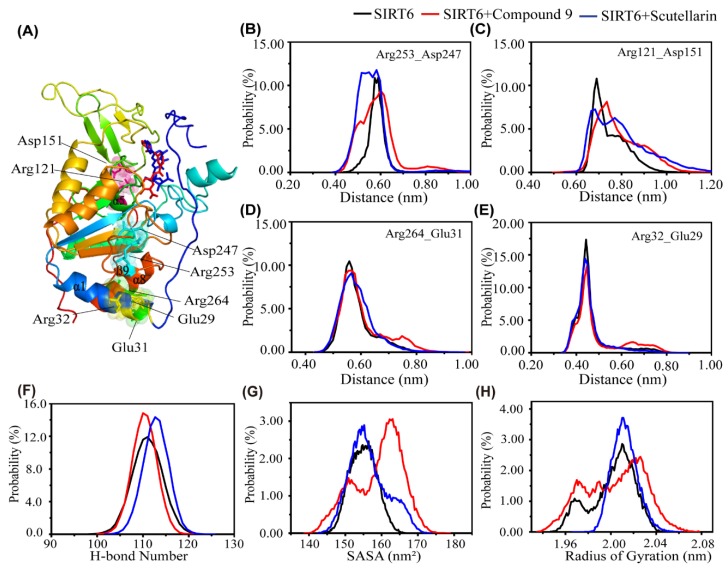
Figure 5.
The influence of the inhibitors on the salt bridge and conformational properties of SIRT6. (A) Representative conformational snapshot of SIRT6. The SIRT6 protein is shown in cartoon style with the involved residues shown in surface representation and the inhibitors shown as sticks using PyMOL. The distance between Arg253 and Asp247 (B), Arg121 and Asp151 (C), Arg264 and Glu31 (D), Arg32 and Glu29 (E) in the SIRT6 (black), SIRT6+Compound 9 (red) and SIRT6+Scutellarin (blue) systems. (F) The probability distribution function for the number of H–bonds in SIRT6. (G) The probability distribution function of the SASA in SIRT6. (H)The probability distribution function of the radius of gyration in the SIRT6 system (black line), SIRT6+Compound 9 system (red line) and SIRT6+Scutellarin system (blue line).

