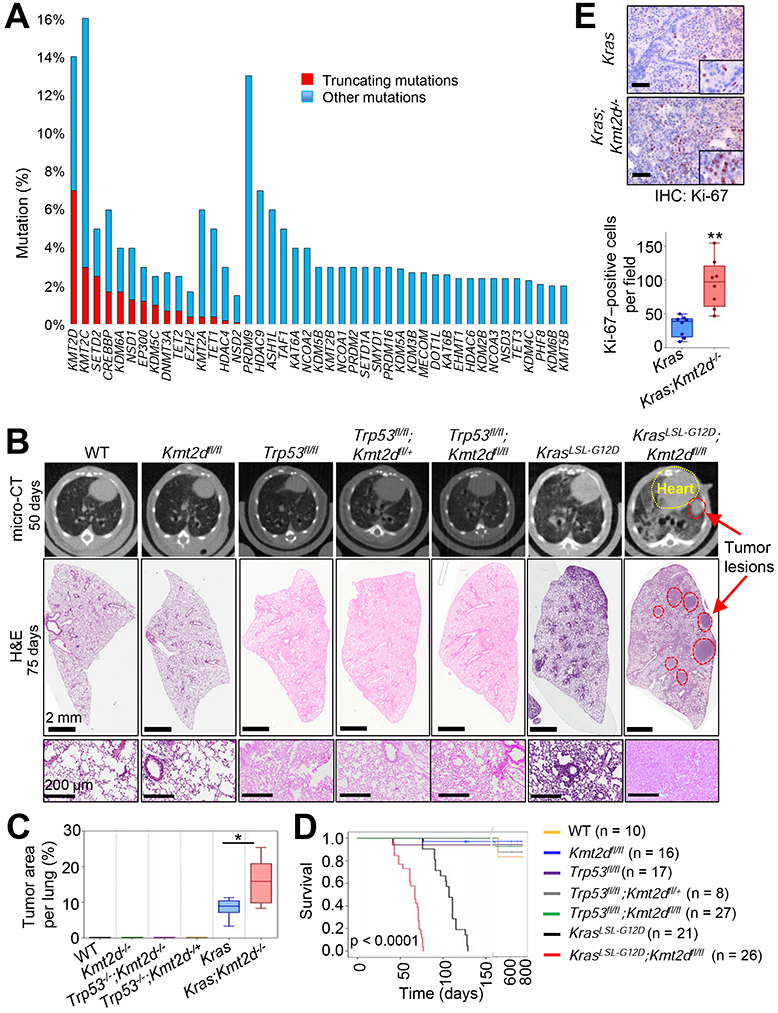
Figure 1. The loss of Kmt2d, whose human homologue is among the most highly mutated epigenetic modifiers in lung cancer, strongly accelerates KRAS-driven LUAD in mice.

(A) Comparison of gene alterations of epigenetic modifiers (histone acetyltransferases and deacetylases, histone methyltransferases and demethylases, and DNA modifiers) in the TCGA Pan-lung cancer dataset. Other mutations represent missense and inframe mutations. (B) Representative images of micro-CT scans (top panels) and H&E-stained tissues (middle and bottom panels) of wild-type (WT), Kmt2dfl/fl, Trp53fl/fl, Trp53fl/fl;Kmt2dfl/+, Trp53fl/fl;Kmt2dfl/fl, KrasLSL-G12D, and KrasLSL-G12D;Kmt2dfl/fl mice. The lungs of the mice were infected with Adeno5 (Ad5)-CMV-Cre viruses. (C) Comparison of tumor area (%) per mouse in the indicated groups of mice (n = 6). (D) Kaplan-Meier survival analysis of the indicated groups of mice. The statistical analysis was performed using the two-sided log-rank test. (E) immunohistochemistry (IHC) analysis for the cell proliferation marker Ki-67 in Kras and Kras;Kmt2d−/− lung tumors. Ki-67-positive cells in ten random fields of three different tumors each from Kras and Kras;Kmt2d−/− groups were quantified. Black scale bars represent 50 μm. In the boxplots in (C) and (E), the bottom and the top rectangles indicate the first quartile (Q1) and third quartile (Q3), respectively. The horizontal lines in the middle signify the median (Q2), and the vertical lines that extend from the top and the bottom of the plot indicate the maximum and minimum values, respectively. *, p < 0.05; **, p < 0.01 (two-tailed Student’s t-test). See also Figures S1 and S2.
