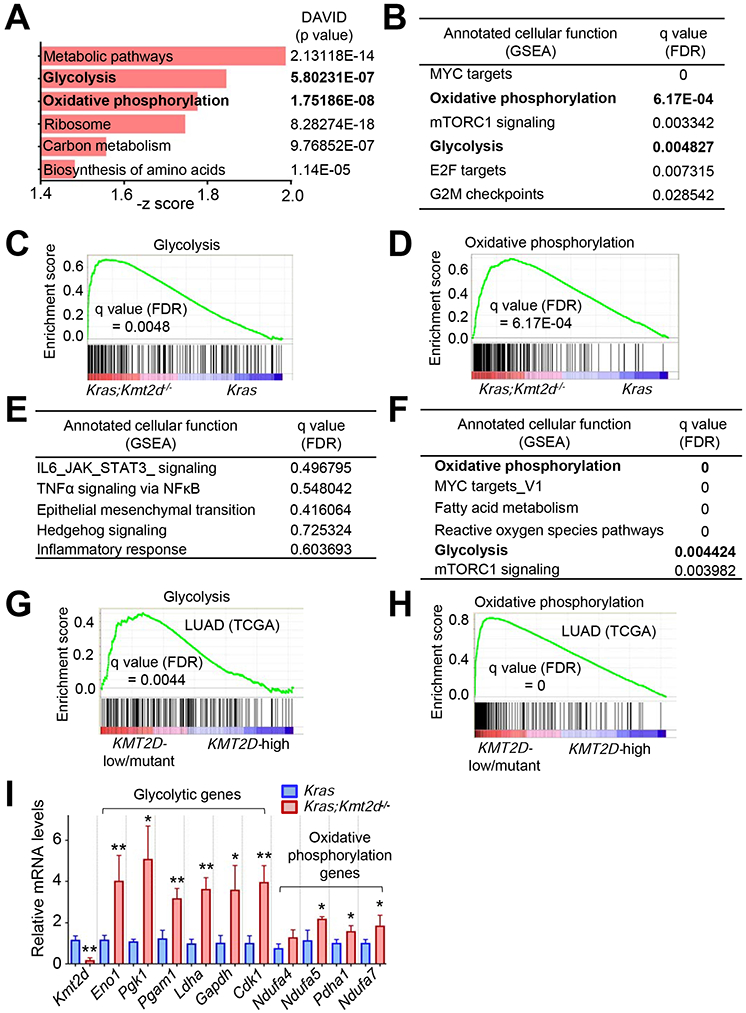
Figure 2. Kmt2d loss upregulates tumor-promoting programs, such as glycolysis.

(A) Ontology analysis of genes (n = 1113, p < 0.05) upregulated by Kmt2d loss in KRAS-driven mouse LUAD. Gene expression profiles were compared between Kras tumors and Kras;Kmt2d−/− tumors. The functional annotation tool DAVID was used for the analysis. Metabolic pathways include genes for glycolysis, oxidative phosphorylation (OXPHOS), and TCA cycle. (B) Pathways upregulated by Kmt2d loss in KRAS-driven mouse LUAD. FDR, false discovery rate. (C and D) Enrichment plot of glycolytic (C) and OXPHOS (D) genes in Kras;Kmt2d−/− tumors as compared with Kras tumors. Each of the black bars represents a gene in the pathway. (E) Pathways downregulated by Kmt2d loss in KRAS-driven mouse LUAD. (F) Pathways upregulated in human LUAD samples bearing low KMT2D mRNA expression (n = 20) or KMT2D-inactivating mutations (n = 4) as compared with human LUAD samples (n = 24) bearing high KMT2D mRNA expression. (G and H) Enrichment plot of glycolytic (G) and OXPHOS (H) genes in human LUAD samples bearing low KMT2D mRNA expression or KMT2D inactivation as compared with human LUAD samples bearing high KMT2D mRNA expression For (B–H), the GSEA was performed, and the Benjamini-Hochberg procedure was used for statistical analyses. (I) Analysis of mRNA levels of glycolytic genes and OXPHOS genes in Kras and Kras;Kmt2d−/−lung tumors using quantitative RT-PCR (n = 3). Data are presented as the mean ± SEM (error bars). *, p < 0.05; **, p < 0.01 (two-tailed Student’s t-test). See also Tables S1 and S2.
