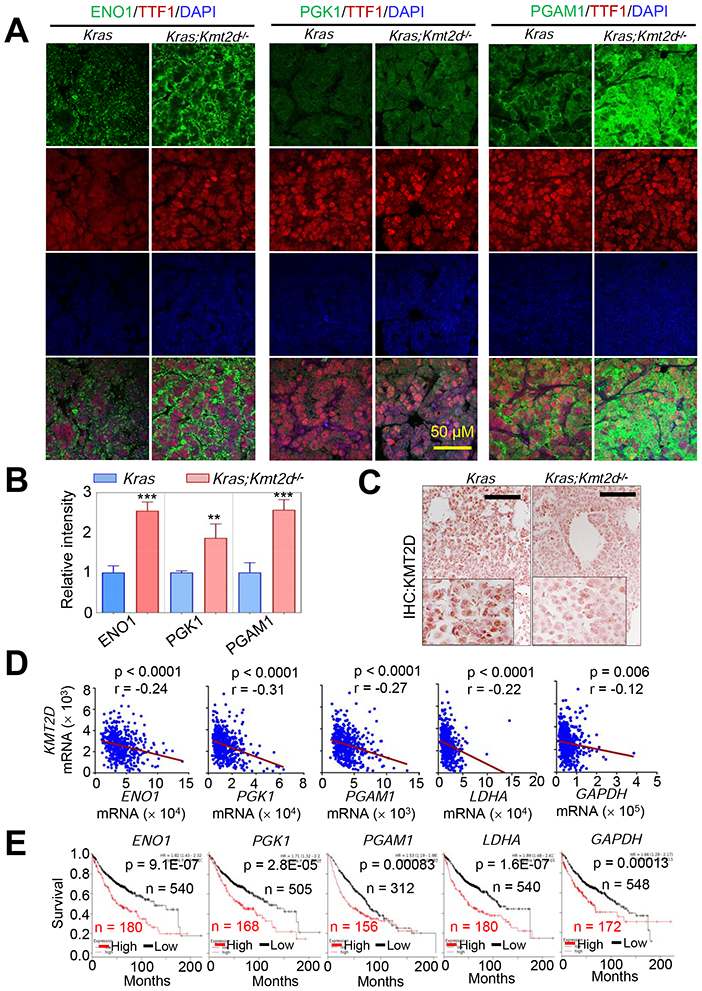
Figure 3. High expression levels of several glycolytic genes negatively correlate with KMT2D mRNA levels in LUADs and are linked to poor prognosis in LUAD patients.

(A and B) Immunofluorescence (IF) analysis for ENO1, PGK1, and PGAM1 in Kras and Kras;Kmt2d−/− lung tumor tissues. Representative IF images are shown (A), and the IF images were quantified (B). TTF1 is an LUAD marker. Data are presented as the mean ± SEM (error bars) of at least three independent experiments or biological replicates. **, p < 0.01; ***, p < 0.001 (two-tailed Student’s t-test). (C) IHC analysis for KMT2D in Kras and Kras;Kmt2d−/− lung tumor tissues. Black scale bars, 50 μm. (D) Inverse correlations of KMT2D mRNA levels with ENO1, PGK1, PGAM1, LDHA, and GAPDH mRNA levels in human LUADs in the TCGA dataset (n = 517). The statistical analysis was performed using two-tailed Student’s t-test. r, Pearson correlation coefficient. (E) Kaplan-Meier survival analysis of human LUAD patients using ENO1, PGK1, PGAM1, LDHA, and GAPDH mRNA levels. Higher quartile (except a best cutoff for PGAM1 data) was used as a cutoff to divide the samples into high (the highest 25%) and low (the remaining 75%) groups in the KM Plotter database (http://kmplot.com/analysis). The statistical analysis was performed using the two-sided log-rank test. KMT2D probe set, 227527_at; ENO1 probe set, 201231_at; PGK1 probe set, 227068_at; PGAM1 probe set, 200886_at; LDHA probe set, 200650_s_at; GAPDH probe set, 212581_at.
