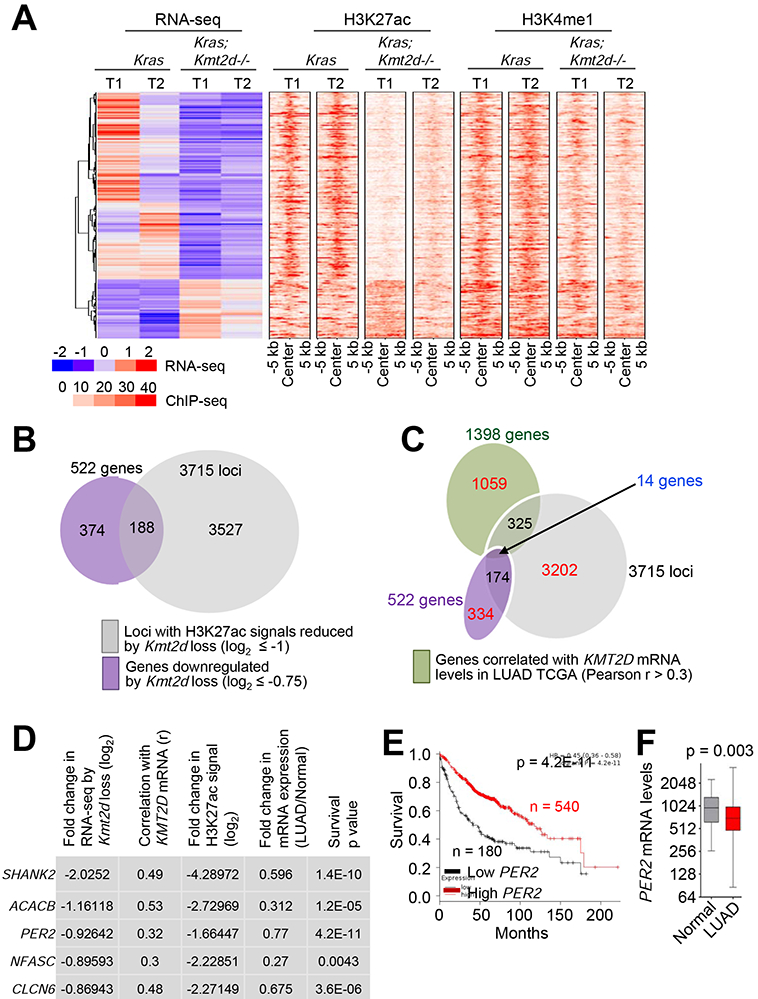
Figure 6. Integrative analysis of expression, enhancers, and clinical relevance for KMT2D-regulated genes.

(A) Heat maps for genes differentially expressed between Kras and Kras;Kmt2d−/− lung tumors and for the signals of their closest H3K27ac and H3K4me1 peaks. (B) A Venn diagram showing the overlap between genes downregulated by Kmt2d loss (n = 522) and genes with H3K27ac ChIP-seq signals reduced by Kmt2d loss (n = 3715). (C) A Venn diagram showing the overlap between genes downregulated by Kmt2d loss (n = 522), genes with H3K27ac ChIP-seq signals reduced by Kmt2d loss (n = 3715), and genes correlated with KMT2D expression (n = 1398 with r ≥ 0.3) in LUAD samples (n = 357) in the TCGA database. (D) The top five hits on the basis of the five different parameters indicated. r, Pearson correlation coefficient. (E) The Kaplan-Meier survival analysis showing the association of low PER2 mRNA levels with poor survival in lung cancer patients. The lower quartile was used as a cutoff to divide the samples into low (the lowest 25%) and high (the remaining 75%) KMT2D mRNA groups. PER2 probe set, 205251_at. In (D) and (E), the p values were calculated using using the two-sided log-rank test. (F) Boxplots showing downregulation of PER2 mRNA levels in LUAD samples (n = 517) as compared with their adjacent normal samples (n = 54) in the TCGA dataset. In the boxplots, the bottom and the top rectangles indicate the first quartile (Q1) and third quartile (Q3), respectively. The horizontal lines in the middle signify the median (Q2), and the vertical lines that extend from the top and the bottom of the plot indicate the maximum and minimum values, respectively. The p value was determined using two-tailed Student’s t-test. See also Figure S7.
