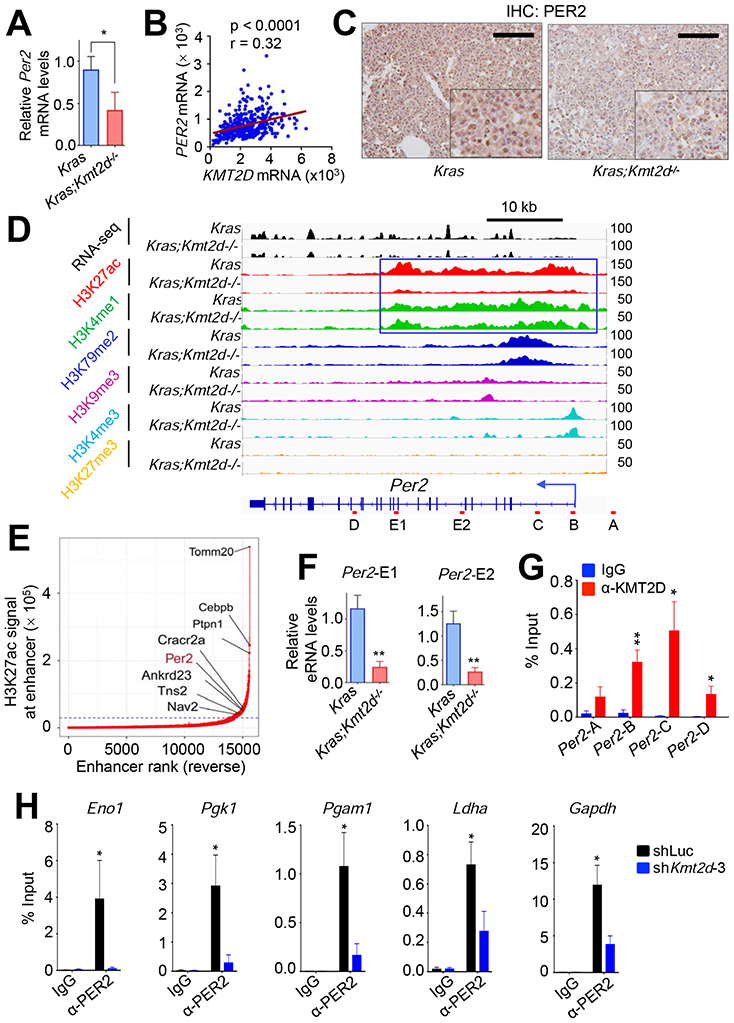
Figure 7. KMT2D positively regulates Per2 expression, and PER2 occupies glycolytic genes.

(A) Analysis of relative Per2 mRNA levels in Kras and Kras;Kmt2d−/− lung tumors using quantitative RT-PCR. (B) A scatter plot showing a positive correlation between KMT2D and PER2 mRNA levels in the TCGA LUAD dataset (n = 517). The statistical analysis was performed using Two-tailed Student’s t-test. r, Pearson correlation coefficient. (C) Analysis of PER2 protein levels in Kras and Kras;Kmt2d−/− lung tumors using IHC. Black scale bars, 50 μm. (D) Genome browser view of normalized ChIP-seq signals of six chromatin marks (H3K27ac, H3K4me1, H3K79me2, H3K9me3, H3K4me3, and H3K27me3) at the Per2 locus in Kras and Kras;Kmt2d−/− lung tumors. All the tracks were average of two biological replicates. The Per2-associated super-enhancer is indicated by the blue-outlined box. (E) A plot indicating super-enhancers identified on the basis of H3K27ac signals. The numbers in X-axis are in reverse order. (F) Analysis of eRNA levels for two different regions (E1 and E2) of the Per2 super-enhancer in Kras and Kras;Kmt2d−/− lung tumors using quantitative RT-PCR. (G) Quantitative ChIP analysis of KMT2D in Per2 in LKR10 cells. (H) Quantitative ChIP analysis of PER2 in glycolytic genes in LKR10 cells. ChIP amplicons are indicated in Figure S7H. In (A), (F), (G), and (H), data are presented as the mean ± SEM (error bars) of at least three independent experiments or biological replicates. *, p < 0.05; **, p < 0.01 (two-tailed Student’s t-test).
