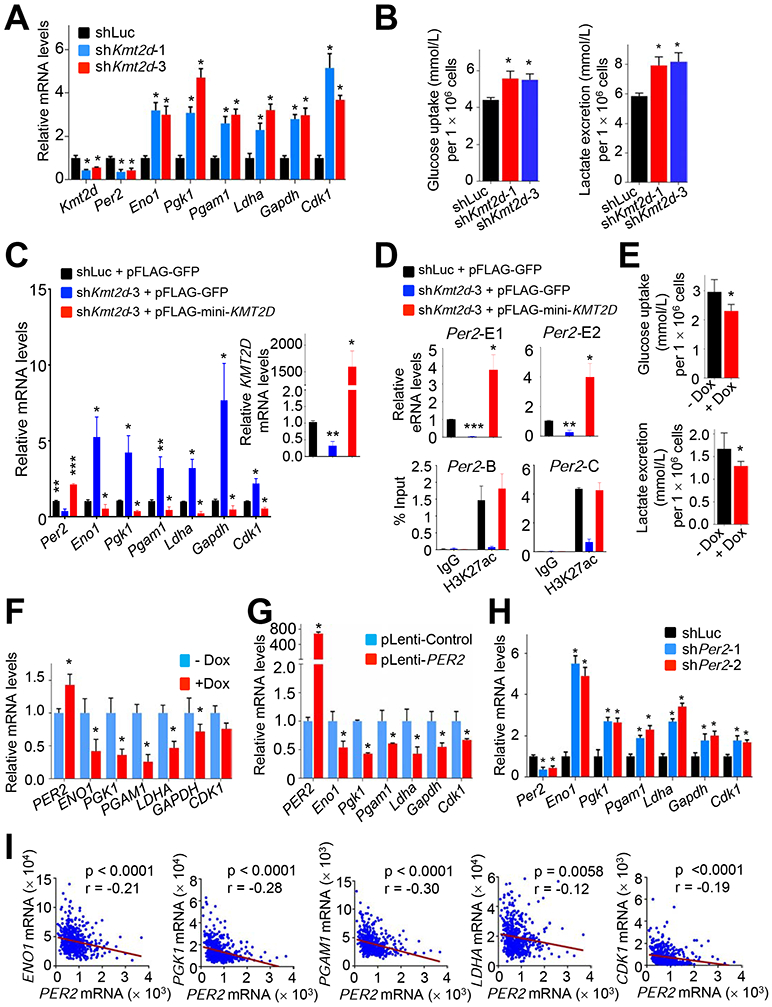
Figure 8. KMT2D-activated Per2 expression represses glycolytic genes.

(A) Analysis of the effect of KMT2D knockdown on Per2, Eno1, Pgk1, Pgam1, Ldha, Gapdh, and Cdk1 mRNA levels in mouse LKR-10 LUAD cells bearing KRASG12D using quantitative RT-PCR. (B) The effect of KMT2D knockdown on glucose uptake (Left panel) and lactate excretion (Right panel) in LKR10 cells. (C and D) Rescue experiments by ectopic expression of a functional but smaller KMT2D protein in LKR10 cells. KMT2D-depleted LKR10 cells were transfected with pFLAG-CMV2 expression plasmids encoding mini-KMT2D. Expression of glycolytic genes (C) as well as eRNA levels for two different regions (E1 and E2) of Per2 (D, Top panels) were analyzed using quantitative RT-PCR. H3K27ac levels were analyzed by quantitative ChIP (D, Bottom panels). (E and F) The effect of Dox-induced KMT2D on glucose uptake (E, Top panel) and lactate excretion (E, Bottom panel) in H1568 cells and on expression of glycolytic genes (F). H1568 cells bearing Dox-inducible KMT2D were treated with 10 μg/ml Dox. (G) Analysis of the effect of exogenous PER2 expression on Eno1, Pgk1, Pgam1, Ldha, Gapdh, and Cdk1 mRNA levels in LKR-10 cells using quantitative RT-PCR. (H) Analysis of the effect of PER2 knockdown on Eno1, Pgk1, Pgam1, Ldha, Gapdh, and Cdk1 mRNA levels in LKR-10 cells using quantitative RT-PCR. (I) Scatter plots showing inverse correlations of PER2 mRNA levels with ENO1, PGK1, PGAM1, LDHA or CDK1 mRNA levels in human LUADs in the TCGA dataset (n = 517). r, Pearson correlation coefficient. In (A–H), data are presented as the mean ± SEM (error bars) of at least three independent experiments or biological replicates. *, p < 0.05; **, p < 0.01; ***, p < 0.001 (two-tailed Student’s t-test). See also Figure S8.
