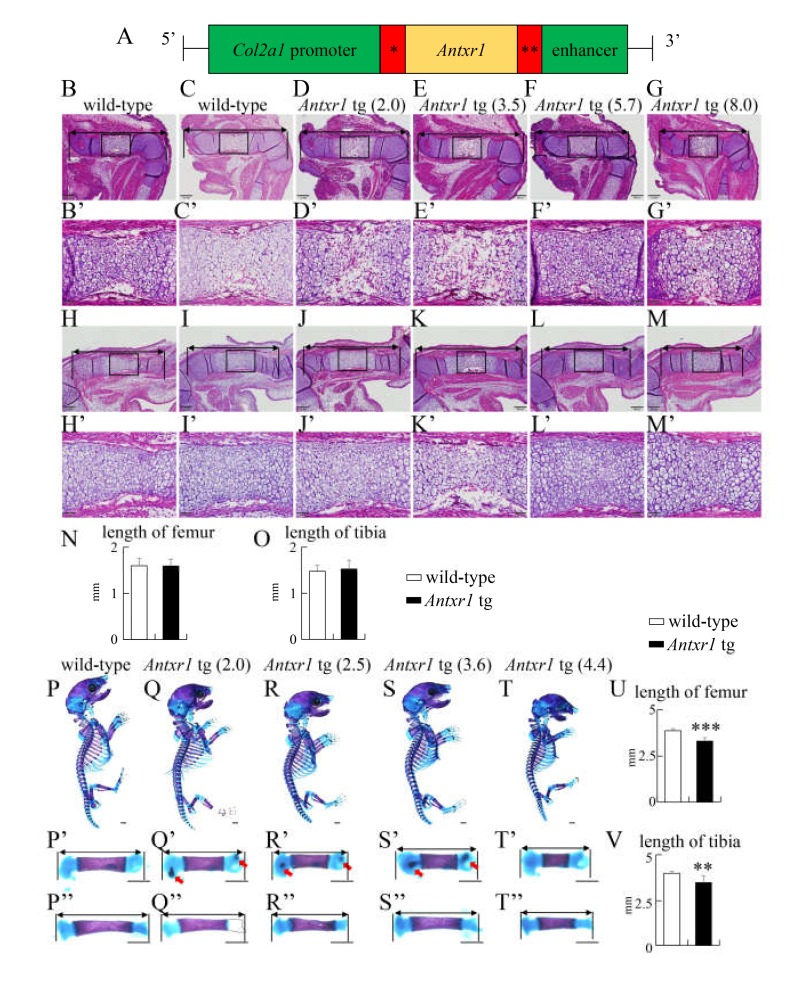
Figure 7.
Generation of Col2a1-Antxr1 tg mice and histological and skeletal system analyses of wild-type and Antxr1 tg embryos at E15.5 and E18.5: (A) Diagram of the DNA construct used to generate tg mice that express Antxr1 under the control of the mouse Col2a1 promoter-enhancer. * Intron from rabbit β globin gene, **Polyadenylation signal from SV40. (B–M) H-E staining of femurs (B–G) and tibiae (H–M) from wild-type (B,C,H,I) and Antxr1 tg (D–G, J–M) F0 embryos at E15.5. The expression level of Antxr1 in wild-type embryos was set as 1, and the relative levels in tg embryos are shown in parenthesis. The boxed regions in B–M are magnified in B’–M’, respectively. (N,O) The lengths of femurs (N) and tibiae (O) at E15.5 were measured using the sections from 5 wild-type and 4 Antxr1 tg embryos at E15.5, as shown in B–M. (P–T) Lateral view of the whole skeletons of wild-type (P) and Antxr1 tg (Q–T) F0 embryos at E18.5: The expression levels are shown in parentheses. The femurs and tibiae were magnified in P’–T’ and P’’–T’’, respectively. The arrows in Q’, R’, and S’ show ectopic mineralization in the cartilage. (U,V) The lengths of femurs (U) and tibias (V) at E18.5 were measured using skeletal preparations, as shown in P’–T’ and P’’–T’’. Scale bars: 200 µm (B–M), 50 µm (B’–M’), 1 mm (P–T,P’–T’,P’’–T’’). The number of embryos analyzed: H-E staining at E15.5, wild-type: 5, Antxr1 tg: 4; skeletal system at E18.5, wild-type: 9, Antxr1 tg: 4. Versus wild-type embryos, ** p < 0.01, *** p < 0.001.

