Figure 10.
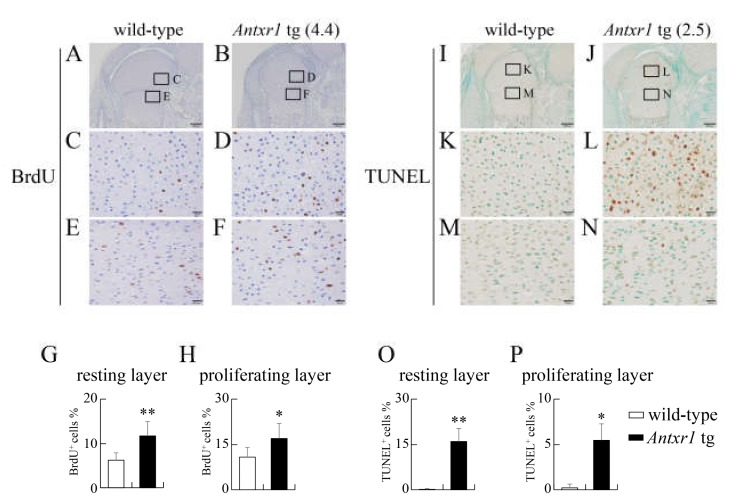
Proliferation and apoptosis in femurs of wild-type and Antxr1 tg embryos at E18.5: (A–H) BrdU staining (A–F) and the frequencies of BrdU-positive chondrocytes in the resting (A–D,G) and proliferating (A,B,E,F,H) layers of wild-type (A,C,E) and Antxr1 tg (B,D,F) F0 embryos. (I–P) TUNEL staining (I–N) and the frequencies of TUNEL-positive chondrocytes in the resting (I,J,K,L,O) and proliferating (I,J,M,N,P) layers in wild-type (I,K,M) and Antxr1 tg (J,L,N) F0 embryos at E18.5. The boxed regions in A, B, I, and J are magnified in C and E, in D and F, in K and M, and in L and N, respectively. The expression levels in tg embryos are shown in parentheses. Scale bars: 200 µm (A,B,I,J) and 20 µm (C–F, K–N). The number of mice analyzed: BrdU staining, wild-type: 6, Antxr1 tg: 4; TUNEL staining, wild-type: 4, Antxr1 tg: 4. The expression levels in tg embryos analyzed are shown in Figure 7Q–T. Versus wild-type, *p < 0.05, ** p < 0.01.

