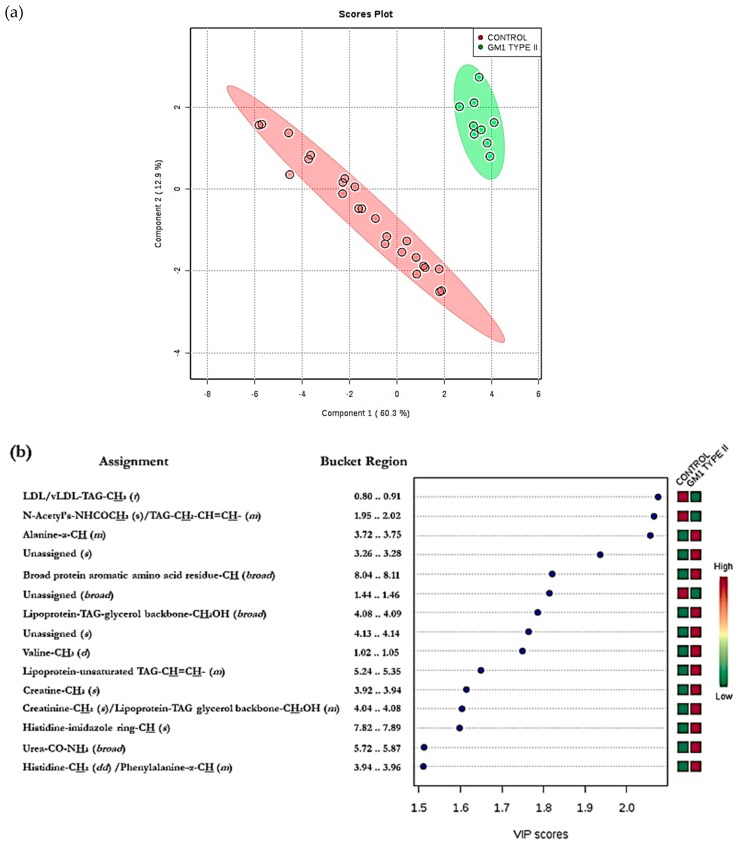
Figure 3.
Multivariate analysis of spectral data from GM1 Type II and control plasma integral bucket regions. (a) PLS-DA scores plot showing controls (red) and GM1 Type II (green) together with 95% confidence ellipses. PC1 and PC2 represent 60 and 13% of the dataset variance respectively. Removal of all glucose ISB regions, which were clearly elevated in GM1 Type II participants in view of the non-fasting of participants, was performed prior to simulation of this plot. (b) Plot of variable importance parameter (VIP) values arising from the PLS-DA analysis, showing significantly greater intensity intelligent bucket regions, with their corresponding metabolite assignments. The red and green right-hand side abscissa axis represent metabolites which are elevated or depleted in GM1 Type II or control plasma samples respectively. The higher the VIP score, the more important the bucket region is considered in the PLS-DA model (all VIP values ≥ 1 are considered significant). Abbreviations: LDL, low-density-lipoprotein; TAG, triacylglycerol; vLDL, very-low-density-lipoprotein.

