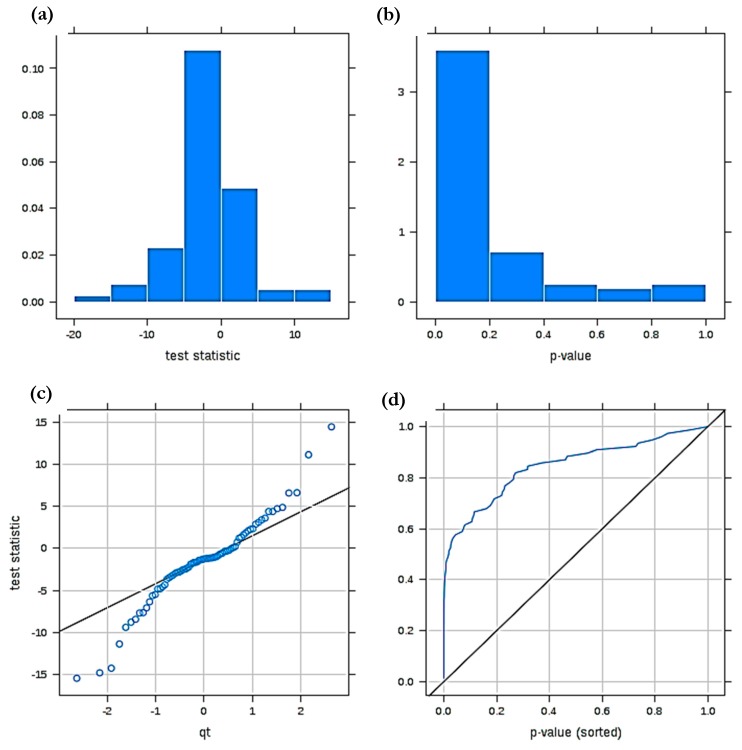
Figure 4.
Diagnostic plots derived from a MV statistical power calculation conducted on a model involving comparisons between the 1H NMR profiles of human blood plasma collected from healthy humans (controls) and GM1 type II gangliosidosis patients. (a) t statistic value p value distribution displayed as a histogram; (b) corresponding QQ plot of these t-test values (i.e., t versus qt value); (c) left-shifted distribution of t-test statistic p values for this power analysis; (d) plot of sorted t statistic p values versus their ranking. The dataset was constant-sum normalised, cube root-transformed and Pareto-scaled prior to analysis.

