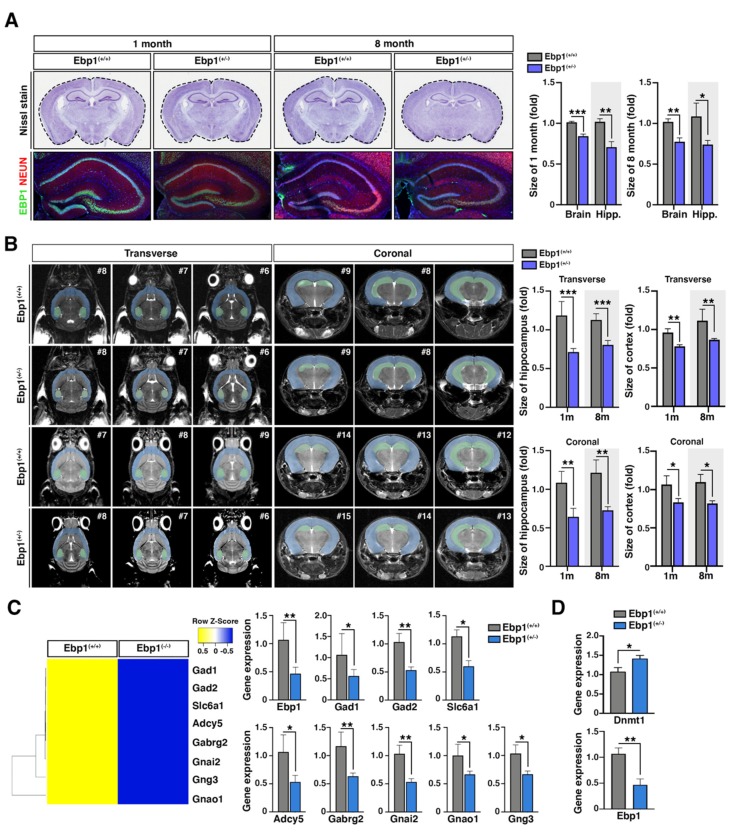
Figure 1.
Deficits in hippocampus development in Ebp1(+/−) mice. (A) Ebp1(+/+) and Ebp1(+/−) 1 month and 8 month old mouse brains were isolated and subjected to Nissl staining (to compare the brain sizes (upper)) or was stained with anti- ErbB3-binding protein 1 (EBP1) (red, marker for EBP1) and anti-NEUN (green, marker for neuronal cell) antibodies (to compare sizes of hippocampus (bottom)). The whole brain size of Ebp1(+/−) mouse was smaller than that of Ebp1(+/+) for about 15%. Especially, the hippocampus size was much smaller than that of Ebp1(+/+) for about 30% 8 months after birth. Bar graphs display quantified data (right). * p < 0.05, ** p < 0.01, *** p < 0.001. scale bar: 500 μm. (B) Representative images of the whole brain structure of Ebp1(+/+) and Ebp1(+/-) mouse are shown; coronal (right) and transverse (left) T2-weighted images; MRI images of brain from 1 month (upper) or 8 month mice (bottom). Representative galleries of T2-weighted MRI images are shown. MRI was used to determine the size of hippocampus. The hippocampus (light green) and cortex (light blue) are highlighted. Bar graphs display quantified data (right). * p < 0.05, ** p < 0.01, *** p < 0.001. (C) The hierarchical clustering of differentially expressed RNA of GABAergic neuron gene set was derived using microarray of E12.5 Ebp1 deficient mouse brain samples. In the cluster heat map, red indicates high relative gene expression and green indicates low relative gene expression. To confirm down regulation of GABAergic neuron gene set, we performed qRT-PCR on hippocampus samples from 8-month-old Ebp1 WT and heterozygous mice. * p < 0.05, **p < 0.01. (D) RNA expression level of Dnmt1 (upper) and Ebp1 (bottom) were analyzed using qRT-PCR of hippocampus samples from 8-month-old Ebp1(+/+) and Ebp1(+/−) mice. The relative fold changes were quantified and shown in the bar graphs. * p < 0.05, ** p < 0.01. The mRNA levels were normalized to the levels of Gapdh. All data are shown as the mean ± s.e.m.

