Figure 2.
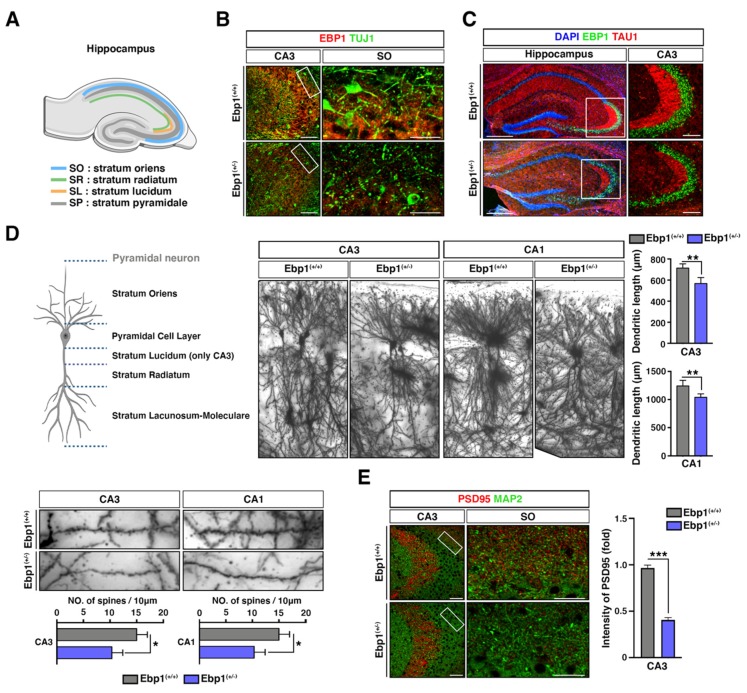
Ebp1(+/−) mice displayed impaired neural development in stratum oriens (SO) of CA3/2 region in hippocampus. (A) representative hippocampus structure is displayed. Created with BioRender. (B) WT and Ebp1 heterozygous mouse brain were isolated and subjected to IHC staining with anti-EBP1 and TUJ1 antibodies, early neuronal markers. CA3 region and cropped specific region as SO are shown. Scale bar: 200 μm. (C) Brain tissues were isolated from Ebp1 WT and heterozygous mice and subjected to IHC analysis. The hippocampus was stained with anti-EBP1 (green) and TAU1 (red, axon specific marker) antibodies. The right-hand panel shows higher magnification of the CA3 region of the hippocampus; corresponding SO region is indicated by a white box. Intensity of Tau1 positive signals were quantified and displayed as bar graphs (right). Scale bar: 200 μm. (D) Fresh mouse brain tissues were stained with Golgi-Cox stain. Golgi-stained CA1 and CA3 hippocampal neurons (upper right) and their dendritic processes (bottom left) are shown, respectively. Total dendritic length was measured using image J. Dendrite numbers in the SO region of pyramidal neurons were counted within every 10 μm. * p < 0.05, ** p < 0.01. Created with BioRender. (E) Brain tissues, isolated from Ebp1(+/+) and Ebp1(+/−) mice, were stained with anti-PSD95 (red, marker for post-synapse) and MAP2 (green, marker for dendrites) antibodies. High power images show PSD95 and MAP2 double-labeling in the CA3 and corresponding SO regions (left). The intensity of PSD95 was quantified and shown as a bar graphs (right). *** p < 0.001. Scale bar: 200 μm. All data are shown as the mean ± s.e.m.

