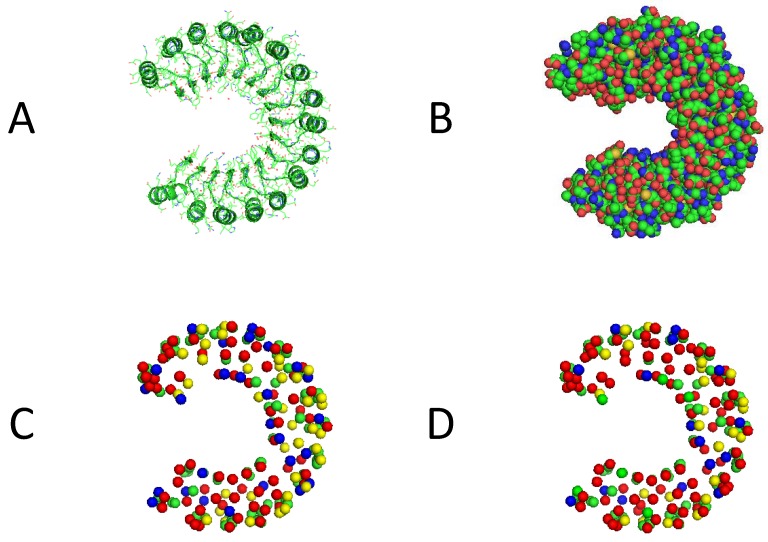
Figure 3.
Visualization results of predictions by the proposed methods. (A), (B) represent the cartoon and spheres form of 1a4y-a, and (C), (D) represent predictions based on RENN-XGB and IHT-XGB methods, where green, red, yellow, and blue ball represent the predictions of TP, TN, FP and FN, respectively.

