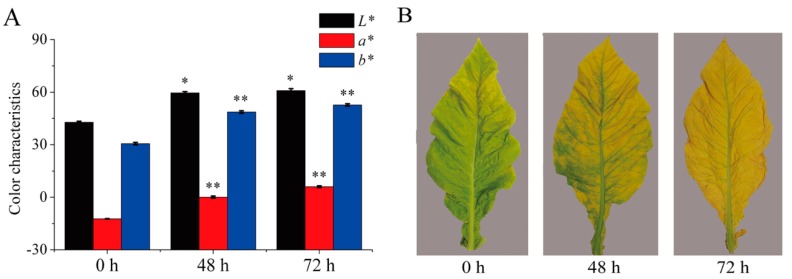
Figure 1.
Color and phenotypic changes in tobacco leaves during curing. (A) The leaf color values of L*, a*, and b* were determined during curing. Data are shown as the means ± SE, n = 30. Asterisks indicate significant differences between the values at 0 h and 48 h or 72 h based on Duncan’s multiple range test in SPSS (* p < 0.05, ** p < 0.01). (B) Representative tobacco leaf phenotypes were documented for each flue-curing stage.

