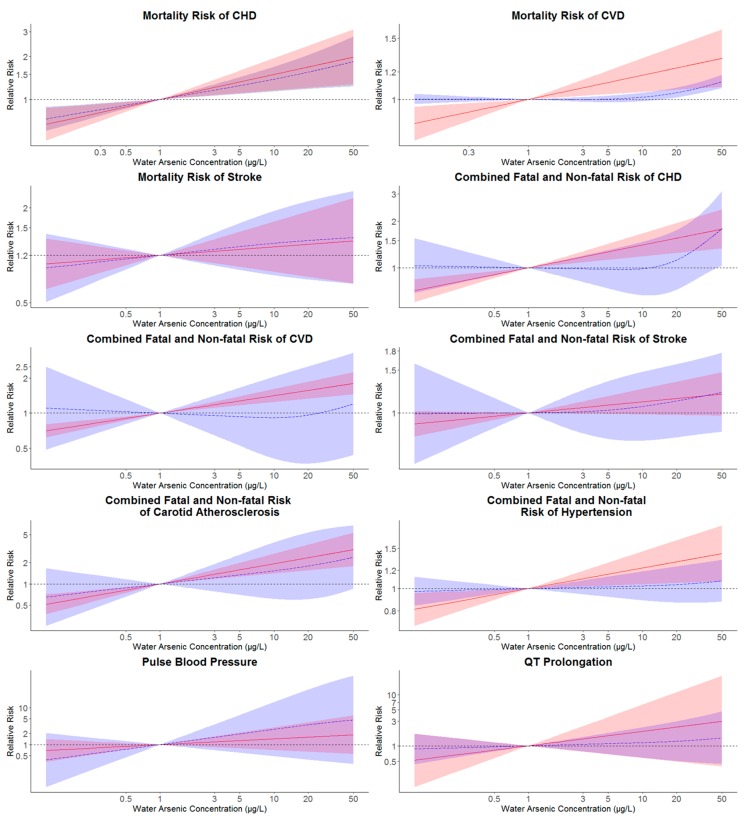
Figure 2.
Pooled log-linear and non-linear relative risks and 95% confidence intervals (CIs) of different CVD endpoints in relation to the estimated drinking water arsenic concentration. Pooled log-linear and non-linear relative risks of CVD endpoints were estimated for drinking water arsenic concentrations with reference to an arsenic concentration of 1 µg/L. Solid lines (red) correspond to pooled relative risks of linear models with their 95% CIs represented as shaded regions (red). Pooled relative risks of non-linear models were represented by long-dash lines (blue) and their 95% CIs were plotted as shaded areas (blue). Log-linear models were estimated with log-transformed estimated drinking water arsenic concentration and non-linear associations were estimated from models with restricted cubic splines of log-transformed water arsenic concentration with knots at the 10th, 50th and 90th percentiles of log-transformed water arsenic (CVD: cardiovascular disease; CHD: coronary heart disease).

