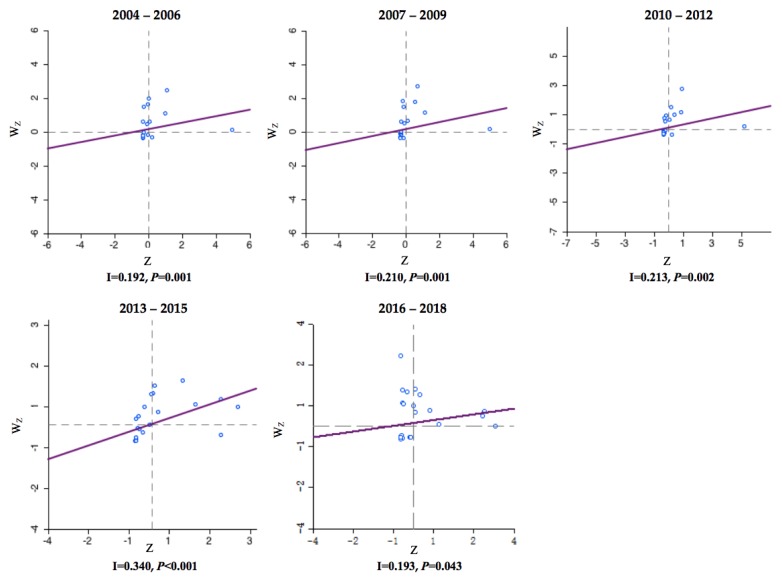
Figure 5.
The Moran’s I scatter plots of the annual incidence of HB in China from 2004 to 2018 (by 3 year period). The first to fourth quadrants of the Moran scatter plot correspond to high–high, low–high, low–low, and high–low correlations of local Moran’s I. The horizontal axis of the Moran scatter plot is the observed and normalized z-score () for a specific province or district, and the vertical axis is the weighted sum of observed and normalized z-score for the neighboring provinces or districts ( ). The individual dots represent the specific 34 provinces or districts.

